The latest info on influencer marketing trends, micro influencer news, and the world of social media

Inventory decisions force ecommerce sellers into a costly tradeoff. Buy too much and cash sits in slow-moving stock. Buy too little and a product launch, promotion, or creator campaign can empty a hero SKU before replenishment arrives.
Inventory demand forecasting gives Amazon sellers, Shopify merchants, and DTC brands a disciplined way to estimate future unit demand and turn it into purchase orders. The goal is not perfect prediction. It is a repeatable system that separates baseline demand from planned events and connects marketing decisions to inventory, fulfillment, and cash.
Inventory demand forecasting is the process of estimating how many units customers are likely to buy over a defined period, then converting that estimate into replenishment decisions. A complete forecast accounts for expected demand, uncertainty, supplier lead time, sellable inventory, inbound stock, reserved units, and known events such as promotions or launches.
Demand forecasting predicts customer purchases. Inventory planning decides what to order, when to order it, and where to place it. Revenue forecasts help finance, but ecommerce buyers need unit forecasts by SKU because a dollar total cannot tell a warehouse how many blue medium shirts, refill packs, or Amazon FBA units to receive.
Small planning errors compound quickly at ecommerce scale. The U.S. Census Bureau reported $326.7 billion in seasonally adjusted U.S. retail ecommerce sales for the first quarter of 2026, up 9.8% from the first quarter of 2025 and equal to 16.9% of total retail sales.
Express the forecast at the level where a decision can be made:
Forecasting also needs to connect with the operational constraints described in why order fulfillment breaks ecommerce growth. A mathematically accurate forecast still fails if the team uses an unrealistic lead time, overlooks receiving delays, or cannot move units to the location where customers are buying.
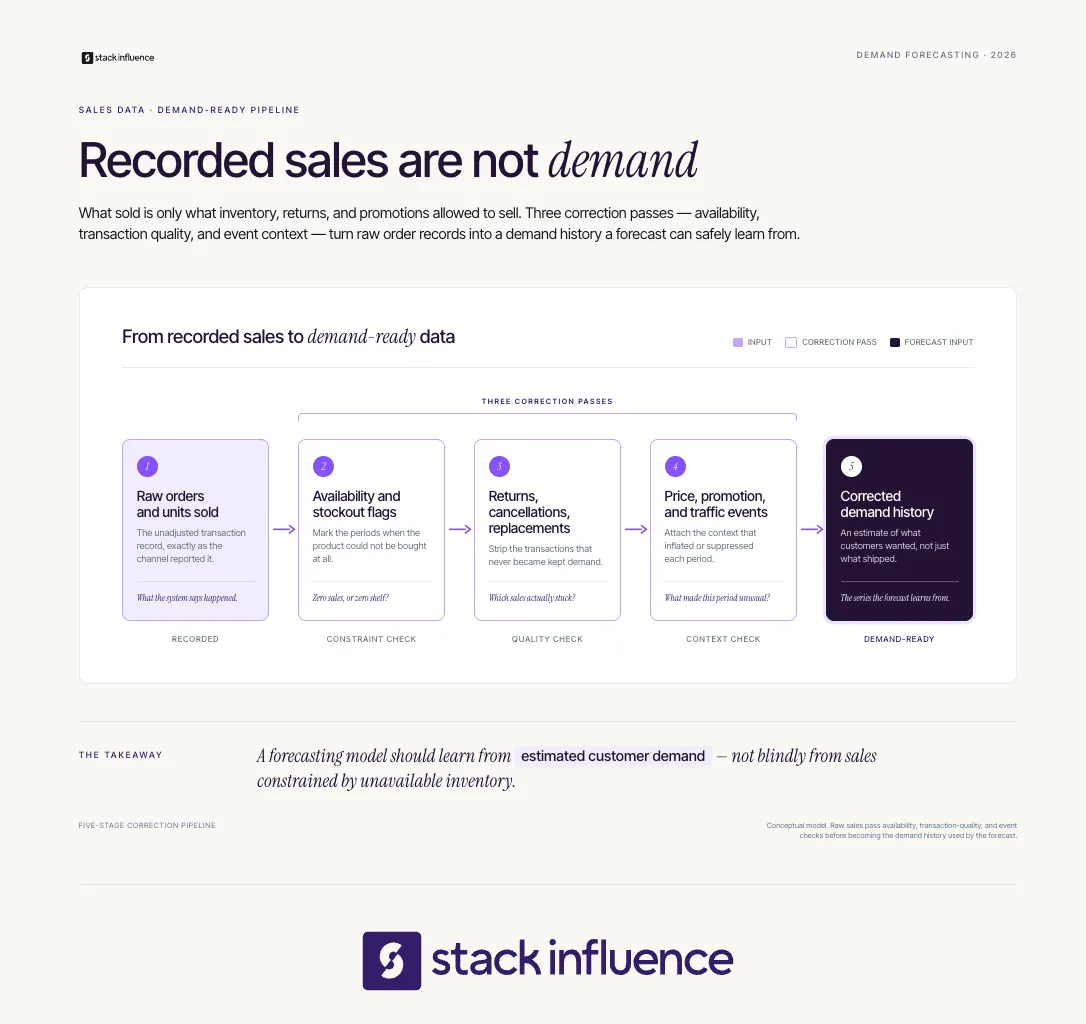
Recorded sales are only a clean demand signal when customers had a fair chance to buy. Once a SKU stocks out, loses the Featured Offer, becomes unavailable at a location, or is temporarily suppressed, sales become a censored version of demand. The historical file may show zero units even though customer interest remained.
Research published in the International Journal of Forecasting examines how lost-sales inventory policies affect demand forecasting, reinforcing a practical lesson for ecommerce teams: availability conditions belong in the data, not just in an operations note.
Before fitting a model, build a demand-ready dataset with:
Shopify exposes fields such as days in stock, days out of stock, inventory units sold per day, and days of inventory remaining in its analytics field reference. Those availability fields help distinguish weak demand from weak availability.
Correct stockout periods conservatively. A practical method is to estimate lost demand from the SKU’s in-stock velocity immediately before and after the gap, adjusted for seasonality and campaign activity. Mark the correction as estimated so planners can compare raw sales, corrected demand, and the final forecast rather than hiding assumptions.
For Amazon sellers, the risk is broader than one missed order. A stockout can interrupt sales velocity and campaign timing, which is why running out of inventory can affect Amazon rank. The forecast should flag days when marketing is scheduled but sellable stock may fall below the campaign requirement.
The Baseline-to-Buy Forecasting Framework turns historical demand into a purchasing decision through five stages: establish the baseline, add event demand, create scenarios, translate demand into inventory, and review forecast error. Each stage has a separate job, which prevents promotions, safety stock, and ordinary customer demand from being counted twice.
Start with the simplest method that reflects the SKU’s pattern. A sophisticated model is not automatically more accurate, and a basic seasonal baseline often provides a stronger benchmark than an unexplained software forecast.
Match the method to the demand pattern:
Use daily data for high-volume SKUs when replenishment can react daily. Weekly data is often more stable for lower-volume products. Monthly data may be too slow for brands running short campaigns or managing long lead times.
For new products, combine quantitative analogs with qualitative judgment. IBM’s demand forecasting tutorial notes that qualitative methods are especially useful when historical data is limited, which is the normal condition for a launch.
The event layer adjusts the baseline for planned actions that can change demand. These include discounts, paid advertising, email campaigns, retail placements, Amazon storefront features, affiliate pushes, product launches, and creator partnerships.
For every planned demand event, record the affected SKU, channel, launch and end dates, offer, expected sales window, inventory reserved for execution, measurement tag, and low, base, and high unit assumptions. For Shopify campaigns, the workflow in the Shopify influencer marketing playbook helps connect creator activity, store traffic, and contribution margin before content goes live.
Amazon sellers can use Amazon Attribution to measure tagged non-Amazon search, social, display, video, and email activity. Amazon reports a 14-day attribution window and metrics including clicks, detail page views, add-to-cart actions, purchases, units sold, and product sales.
Use separate tags for major tactics so future forecasts can learn from actual event performance. Stack Influence’s Amazon Attribution guide explains how tagged external campaigns can support that reporting workflow.
A verified Stack Influence case study shows why creator activity needs an explicit scenario. During a three-month new-product campaign for Targus, average monthly unit sales increased from 56 at the starting point to 221 during the measured campaign period. The campaign included 120 creator promotions, 275,560 social impressions, and 4,323 engagements. The example does not prove that creator activity caused every sales change, but a baseline-only forecast would not have represented the observed demand shift.
Keep product-seeding inventory separate from consumer demand. Creator units, replacements, damaged shipments, and content samples reduce available stock even when they are not customer orders. The operational steps in these influencer product seeding strategies can be added to the same calendar.
A single forecast hides uncertainty. Build three cases around the assumptions that matter most, such as conversion rate, campaign reach, supplier timing, price, or repeat purchase.
Document each assumption in units, not adjectives. “Strong launch” is not auditable. “Baseline of 18 units per day plus 240 event units over two weeks” can be compared with reality.
Each scenario should trigger a decision. The low case may delay a second purchase order. The base case may reserve normal safety stock. The high case may require faster freight, a supplier option, or a marketing cap once weeks of supply falls below a threshold.
A forecast becomes useful when it produces a reorder date and order quantity. The planning horizon must cover production, freight, customs, receiving, quality checks, warehouse transfer, marketplace check-in, and the next review period.
Use three linked calculations:
The preliminary order quantity is the target inventory position minus the current inventory position. Then adjust for minimum order quantities, case packs, shelf life, storage limits, cash constraints, and supplier reliability.
Suppose a SKU is forecast to sell 14 units per day, replenishment takes 42 days, the team reviews inventory every seven days, and safety stock is 110 units. Target stock is 796 units: 14 multiplied by 49 days, plus 110. If the inventory position is 355 units, the preliminary purchase order is 441 units before case-pack or MOQ rounding.
Safety stock should absorb the uncertainty left after expected demand is modeled. Planned promotion lift belongs in the forecast itself, while the buffer protects against forecast error, supplier variation, and unexpected demand. Treating the same lift as both planned demand and safety stock creates an inflated buy.
Shopify’s inventory reports calculate days of inventory remaining from ending inventory divided by average units sold per day, using recent sales to estimate depletion. That metric is a useful warning, but a campaign-aware forecast should replace the backward-looking average when a known event is approaching.
Amazon’s official demand forecast tool provides eligible sellers with estimated future demand for products for up to 40 weeks. Treat it as an input to compare with the brand’s own assumptions, not as a substitute for supplier, campaign, and cash planning.
Teams preparing a marketplace launch can pair the forecast with these Amazon launch strategies. Brands using shared inventory across channels should also define allocation rules before traffic scales, as described in the guide to Amazon Multi-Channel Fulfillment.
Update the forecast on a fixed cadence and preserve prior versions. Without snapshots, a team can overwrite history and make the model look more accurate than it was.
Compare each model with a simple baseline. Forecasting: Principles and Practice explains that accuracy should be evaluated on data not used to fit the model, because a strong fit to training data does not guarantee strong forecasts. Its forecast accuracy guidance also notes that MAPE becomes undefined when actual demand is zero and unstable when actual demand is near zero.
For recurring evaluation, use rolling-origin testing. The textbook’s time-series cross-validation method repeatedly trains on past observations and tests on the next period, preventing future data from leaking into the forecast.
Record planner overrides separately from the statistical baseline. Then calculate whether the override improved or worsened error. This creates forecast value added, a practical way to identify useful judgment and eliminate habitual optimism.
The right method depends on demand shape, value, lead time, and decision frequency. Ecommerce teams should not force every SKU through one model. Stable hero products can support tighter statistical planning, while volatile launches and long-tail items need wider scenarios, simpler rules, or more frequent human review.
Use a Value-Variability Map:
This map complements ABC inventory analysis because revenue importance does not describe predictability. A high-revenue seasonal SKU and a high-revenue steady replenishment SKU deserve different models even when both are operational priorities.
Apply one governing rule: forecast at the level where the demand pattern remains meaningful. Splitting a slow SKU into daily channel-location series can create mostly zeros. Aggregating a fast SKU across Amazon and Shopify can hide a channel shift. Choose the lowest level that still has enough signal to support a decision, then reconcile the result to product-family and company totals.

Forecast quality should be measured with both statistical and operational metrics. Error shows how closely the forecast matched demand, while availability, excess stock, and cash show whether the process improved the business. A forecast can score well statistically and still fail if it triggers late orders or ties up too much working capital.
Use a Forecast Control Panel with five metric groups:
WAPE is calculated as total absolute forecast error divided by total actual units. It is useful for a portfolio because high-volume SKUs receive appropriate weight, but it can still hide whether errors are consistently high or low. Bias must therefore be reported beside accuracy.
Review metrics at the same horizon used for purchasing. A seven-day forecast score does not validate a 90-day supplier commitment. Long-lead products should be evaluated at the lead-time horizon because that is when the original decision had to be made.
Attribution metrics belong in the event layer, not the baseline score. Amazon Attribution units sold can help recalibrate future Amazon influencer campaigns, while Shopify links, discount codes, and analytics can inform future Shopify influencer marketing assumptions. Treat the Amazon Brand Referral Bonus as a profitability adjustment rather than additional unit demand.
Do not treat correlation as proof of causation. Report baseline demand, tagged event sales, total observed demand, inventory availability, and the scenario assumptions together. This makes it easier to learn from campaigns without claiming that every sales movement came from one channel.
Most forecast failures come from process design rather than advanced mathematics.
The Baseline-to-Buy Forecasting Framework works best as an operating rhythm, not a one-time spreadsheet. Start with clean unit history, correct constrained periods, build a simple baseline, add known events, create scenarios, and translate the result into a reorder decision. Then judge the process by both forecast error and business outcomes.
For ecommerce teams planning creator activity, product launches, or marketplace expansion, the next step is to place the marketing calendar beside the inventory plan and make every expected demand event visible before the purchase order is approved. A managed product-seeding workflow can support that coordination when creator activation and campaign timing become too complex to track manually.
Instagram Stories can turn a product demonstration into a direct shopping path, but only when the destination, tracking, and disclosure are set up correctly. A plain Amazon URL sends traffic but does not earn affiliate commission. A tagged Associates link can earn on qualifying purchases, while an Amazon Influencer storefront works better for curated collections.
This guide explains how to add an Amazon link to an Instagram Story, choose the right link type, publish a clear Story, disclose any material connection, and measure what happens after viewers tap.
Choose the link based on what you want the viewer to do. Use a product link for one featured item, an Amazon Influencer storefront or Idea List for a collection, an Associates link when you want commission tracking, or a brand-supplied URL when a campaign requires its own attribution.
A direct product link takes the viewer to one Amazon product detail page. This is the clearest destination when your Story demonstrates a specific item, color, model, or size.
Anyone can share an ordinary Amazon product URL, but a standard URL does not contain your Amazon Associates tracking tag. You will not receive affiliate commission simply because someone purchases after clicking an untagged link.
An Associates link is a special tagged URL connected to your Store ID or Tracking ID. Amazon uses the tag to identify eligible purchases that resulted from your referral.
Creators should generate these links through Amazon’s official tools. The Amazon Associates Program guide provides additional background on tagged links, commissions, and program participation.
The Amazon Influencer Program gives approved creators a customizable storefront and vanity URL. A storefront is useful when your Story references several products or when you want followers to browse your broader recommendations.
An Idea List creates a more focused destination inside the storefront. For example, a beauty creator could link to “Drugstore Makeup Favorites,” while a home creator could use “Small Kitchen Essentials.” Amazon’s social-sharing guidance for influencers specifically encourages creators to share storefront links through social media and use Story Highlights to extend the visibility of product content.
A seller may provide a specific Amazon URL for a product-seeding campaign, sponsorship, or affiliate partnership. That URL might contain the brand’s own tracking parameters, including Amazon Attribution parameters.
Use the supplied URL exactly as instructed. Do not automatically replace it with your own affiliate link or append an Associates tag. Amazon’s Associates Program Policies warn against attempting to claim Associates commission and another program’s attribution from the same traffic.

To add an Amazon link to an Instagram Story, copy the correct Amazon URL, create a Story, open the sticker tray, choose Link, paste the URL, customize the sticker text, place a clear disclosure beside it when needed, test the destination, and publish the completed Story.
Decide whether the Story should send viewers to one product, an Idea List, your complete Amazon storefront, or a brand-provided campaign link.
The visual promise and the destination should match. A Story saying “Here is the exact tripod I use” should open the tripod’s product page, not a storefront containing dozens of unrelated products. This destination-first approach is one of the most important principles when deciding where to put an Amazon affiliate link.
For a non-affiliate link, open the product page in Amazon and use the Share option to copy the URL.
For an affiliate link, sign in to the Amazon shopping app with the account connected to Amazon Associates. Amazon’s Mobile GetLink instructions direct Associates to open a product page, tap the floating Share button, select the appropriate Store ID or Tracking ID, and choose Copy Associates Link. Mobile GetLink currently creates links for product detail pages.
For a storefront or Idea List, open the public page and copy its shareable URL. Check that you are viewing the public version rather than an owner-only editing page.
Open the copied link in a browser before adding it to Instagram. Confirm that it leads to the correct product, size, color, model, and Amazon marketplace.
A U.S. Amazon link may create unnecessary friction for followers who primarily shop through another country’s Amazon store. The right marketplace depends on your audience and the Amazon Associates programs in which you participate.
Open Instagram and start a new Story. Record a video, take a photo, or upload an existing asset from your phone.
The Story should demonstrate why the product is relevant before asking viewers to leave Instagram. Show the item being used, explain the problem it solves, or identify the type of person who may find it useful.
Open the Story sticker tray and select Link. Paste the Amazon URL into the link field.
Instagram’s current Stories guide explains that creators can use the Link sticker for external websites, products, articles, and other URLs. The sticker text can also be customized before publishing.
Replace vague sticker text with a specific action:
Specific language tells viewers what will happen after they tap.
Place any required disclosure directly on the Story and close to the recommendation or link sticker. Do not hide it behind another sticker, place it at the extreme edge of the screen, or rely only on a profile disclosure.
Then add one clear call to action. For example: “I linked the exact version I use below.”
Review the Story for spelling, sticker placement, readability, and disclosure visibility. Check that the link opens the intended Amazon page and contains the correct affiliate or campaign tracking.
Publish the Story, then view it from another account or device when possible. This final check catches incorrect links, unavailable products, and visual elements that cover the disclosure.
The Five-Layer Story Link Check is a pre-publish framework for preventing the most common Amazon Story mistakes. A link should pass all five layers before the Story goes live.
Tracking integrity includes account setup. Amazon’s application guidance for social networks says creators should list the exact URL of the social profile they use and place tagged Associates links on their declared sites. The guidance also says participating social pages should be publicly available.
Run the Five-Layer Story Link Check again before saving a Story to a Highlight. Products, variants, availability, campaign terms, and links can change after the original Story was published.
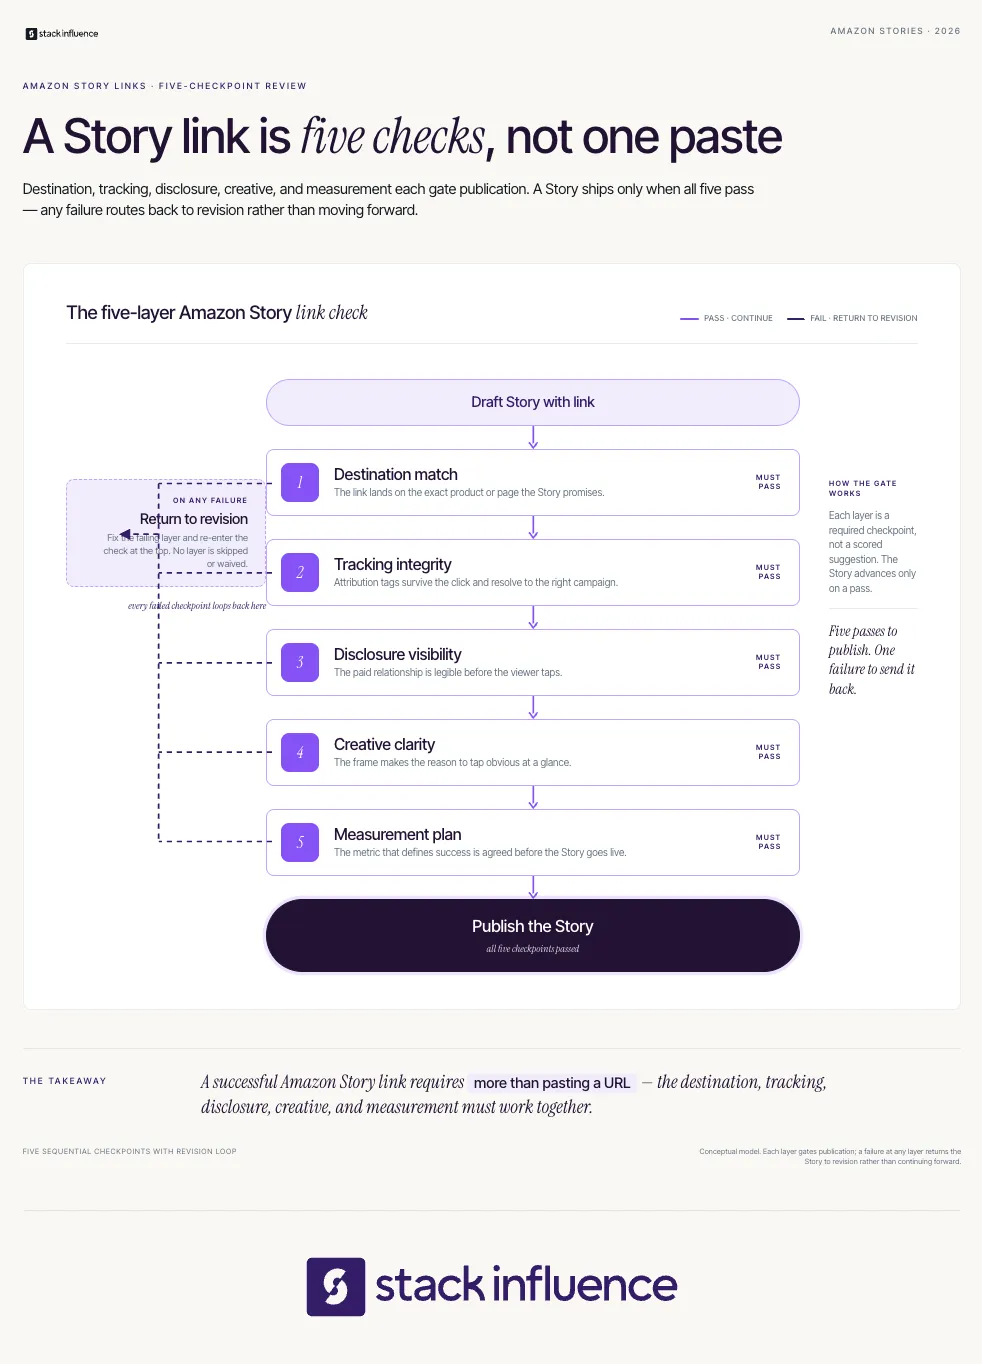
An Amazon affiliate Story should disclose the commission relationship on the Story itself, close to the link sticker, in language viewers can immediately understand. Amazon also requires the account-level Associate statement. A profile-only disclosure is not enough for the individual Story, and Instagram’s partnership label does not replace clear on-frame wording.
Amazon’s social media disclosure guidance says a link-level disclosure must be clear and conspicuous. Amazon gives examples such as “(paid link),” “#ad,” and “#CommissionsEarned.” It also requires the statement, “As an Amazon Associate I earn from qualifying purchases,” to be associated with the creator’s account.
The Federal Trade Commission’s influencer disclosure guidance says disclosures in Instagram Stories should be superimposed over the content and visible long enough to be noticed and read. The FTC also advises creators not to rely only on a profile page, a disclosure hidden among links, or the platform’s built-in disclosure tool.
Useful disclosure formats include:
When the recommendation is part of a paid or gifted brand collaboration, use Instagram’s Paid partnership label when required by Meta’s branded-content rules. Keep a plain-language disclosure on the Story as well, particularly when an affiliate link is involved.
For video Stories, include the disclosure visually. Saying it aloud as well can make the relationship clearer for viewers who are listening, while on-screen text remains necessary for people watching without sound.
More taps usually come from making the recommendation useful before presenting the link. Show the product in context, explain one specific benefit, address a likely question, and use link-sticker text that matches the destination. A short sequence of connected Story frames often communicates more value than one crowded promotional slide.
Use a simple Show, Prove, Point sequence:
For example, a creator could first show a cluttered charging setup, then demonstrate a charging organizer, and finally link to the exact model. The Story earns the click by resolving a specific problem.
Product demonstrations can also become samples for a UGC creator portfolio. Strong product content shows brands that you can communicate naturally, follow campaign requirements, and produce assets that fit social platforms.
Creators pursuing brand deals on Instagram should save examples that combine clear storytelling, product use, disclosure, and measurable action. These examples are more persuasive than screenshots of follower counts alone.
A useful measurement system connects Instagram exposure to Amazon activity. Commission income is an outcome metric, but it does not explain why a Story succeeded or failed.
Use this four-stage metric stack:
Calculate Story Link Tap Rate as:
Link sticker taps ÷ Story reach × 100
Instagram’s Story Insights documentation identifies link taps among the available Story interaction metrics. Amazon’s Associates reporting guidance says its reports include clicks, ordered items, shipped items, conversion rates, and Tracking ID performance.
Use a dedicated Tracking ID for Instagram Stories when available. A separate ID makes it easier to distinguish Story traffic from bio links, blog links, YouTube descriptions, and other affiliate placements.
Amazon generally gives shoppers 24 hours after arriving through an Associates link to place qualifying items in their cart. If an eligible item is added during that window, Amazon says it may remain commission-eligible if purchased before the cart expires, usually within 90 days. The session can end sooner when the customer completes an order or enters Amazon through another Associate’s link.
Interpret the numbers as a connected funnel:
This distinction is central to understanding affiliate marketing versus influencer marketing. Affiliate links measure a direct performance path, while creator content can also create awareness, trust, reusable UGC, and longer-term brand value.
A Story containing an organic Link sticker is not the same as a paid Instagram Stories ad. Meta’s Story boosting guidance says Stories containing link stickers are not eligible for ordinary boosting. A paid Stories ad uses an advertising call-to-action rather than the organic Link sticker.
This matters when a brand wants to amplify creator content. Decide before publishing whether the asset is intended for an organic Story, a partnership ad, a brand-owned ad, or several separate versions.
Do not build one URL that tries to serve every attribution system. An Associates link is meant to track creator-referred commission, while a seller’s Amazon Attribution URL is meant to measure the brand’s external marketing traffic. Confirm which party owns the tracking objective before the Story goes live.
Keep a simple link log containing the publication date, Story topic, product, destination URL, Tracking ID, disclosure wording, and results. This record makes it easier to identify broken Highlights, compare product categories, and prepare campaign reports.
An Amazon Story is more than an affiliate placement. It can demonstrate product storytelling, UGC production, compliant disclosure, audience relevance, and the ability to generate measurable action.
Save your strongest examples, record their link-tap results, and add them to an influencer media kit. Creators can also use these examples when pitching brands or pursuing opportunities available to micro-influencers seeking brand partnerships.
Stack Influence is a micro-influencer marketing platform built around gifted-first product seeding, vetted creator activation, campaign coordination, UGC generation, and completed-post accountability for ecommerce brands. The platform works with roughly 600,000 vetted creators, with approximately 78% of the creator network identified as female.
Knowing how to add an Amazon link to an Instagram Story is only the starting point. The strongest creator workflow connects the right destination, valid tracking, visible disclosure, useful content, and consistent measurement.
Start with one product you genuinely use, build a three-frame Show, Prove, Point sequence, run the Five-Layer Story Link Check, and record the results. Each well-executed Story can improve your affiliate process while producing stronger proof for future creator partnerships.
An ASIN number looks like a small catalog code, but it controls far more than product identification. For Amazon sellers, the correct ASIN determines which detail page receives an offer, which variation shoppers see, which inventory records connect to fulfillment, and which product receives advertising or external traffic.
This guide explains how ASINs work, where to find them, when to reuse or create one, and how to prevent catalog mistakes. It also introduces a governance framework for Amazon FBA sellers, private-label brands, resellers, DTC brands, and multichannel ecommerce teams.
An ASIN number is the 10-character combination of letters and numbers Amazon assigns to a product in its catalog. ASIN stands for Amazon Standard Identification Number, so the phrase “ASIN number” is technically repetitive, but it remains the wording many sellers use when searching for the identifier.
Amazon uses ASINs to distinguish products, group seller offers for the same item on one detail page, organize catalog records, and connect products to advertising workflows. Amazon Ads also states that versions and variations receive distinct ASINs, making the identifier important at the specific product level, not merely the brand or product-family level. Amazon's official ASIN guidance explains these catalog and advertising functions.
One ASIN can support multiple sellers offering the exact product. The ASIN identifies the product record; each seller controls price, quantity, condition, and fulfillment.
The safest way to manage Amazon identifiers is to stop treating them as interchangeable. Each code answers a different operational question, and confusing them can produce duplicate listings, mislabeled inventory, or unreliable reporting.
The ASIN is Amazon's internal catalog identifier. Sellers use it in catalog and advertising workflows, and multiple sellers can attach offers when they sell an exact product match.
A Global Trade Item Number is a standardized identifier used across supply chains and retail systems. Amazon commonly uses GTINs to search for an existing listing or support creation of a new one, while UPC and EAN are common GTIN formats. GS1's GTIN standard and Amazon's GTIN guide explain the relationship.
This distinction matters for multichannel ecommerce. An ASIN belongs to Amazon's catalog, while a GTIN can connect product identity across Amazon, Google, Shopify, warehouses, and retail partners. Google's identifier guidance and Shopify's barcode reference show why the ASIN should not replace a product's global identifier.
Map Shopify variants, GTINs, seller SKUs, and Amazon child ASINs in separate fields. Stack Influence's Shopify and Amazon integration guide covers the broader workflow.
A stock keeping unit is created by the seller. Different sellers can use different SKUs for offers on the same ASIN, and a business may encode color, size, warehouse, or supplier in its SKU structure.
An FNSKU is an Amazon-specific fulfillment identifier used with Fulfillment by Amazon. The ASIN identifies the catalog product, while the FNSKU helps fulfillment operations identify inventory tied to a seller's offer.
Books are the special case. Amazon identifies books through ISBNs, and the International ISBN Agency explains that each ISBN identifies a specific title, edition, and format. A paperback, hardcover, and ebook may therefore require separate identifiers. The International ISBN Agency's definition provides the authoritative context.

You can find an ASIN number in the product's Amazon URL, the Product Information or Product Details section, Seller Central inventory records, and Amazon listing files. For variation products, select the exact size, color, style, or pack before copying the code so you capture the buyable child ASIN rather than another variation.
Use these four methods:
Amazon's current new-ASIN listing guide confirms that sellers can search by GTIN in Add Products, match an existing catalog item, or create a listing when no match exists.
Record the ASIN beside the full variation name. “B0XXXXXXXX, blue, 24-ounce, two-pack” is safer than saving the code alone when a parent page can switch the selected child.
Reuse an existing ASIN when your item is an exact match for the product already represented on the detail page. Create a new ASIN only when the product is genuinely absent from Amazon's catalog and you are authorized to create the listing. Creating a duplicate page for an existing product violates Amazon's detail-page rules.
Amazon's product detail page rules tell sellers not to create duplicate pages and to use only GTINs they own or are authorized to use.
Before matching an offer, verify all identity-defining attributes:
Resellers should also confirm that their seller account can list the exact ASIN in the intended condition and fulfillment channel. The Stack Influence retail arbitrage guide explains why scanning a product is not the same as confirming listing eligibility.
To create a new ASIN, search Amazon's catalog by GTIN first, choose Create a New Listing only when no exact match appears, complete the product and offer fields, and submit the detail page for review. Amazon assigns the ASIN after it accepts the new catalog record, although brand or category approval may be required.
Follow this sequence:
Amazon also supports bulk creation and matching through inventory spreadsheets. Maintain one source-of-truth sheet connecting each GTIN, seller SKU, child ASIN, product title, variation, and marketplace.
A parent ASIN is a virtual catalog record that connects related variations, while a child ASIN is the buyable product representing a specific variation. Amazon's variation relationship guidance describes the parent as a connector and the child as the purchasable item.
Consider a water bottle available in three colors and two sizes. The parent organizes the family, but each color-and-size combination needs its own child ASIN because each combination can have separate inventory, images, price, and sales history.
Correct variation families usually share the same core product and differ only through an Amazon-approved theme such as size, color, style, or flavor. Do not use a variation family to combine unrelated products, materially different models, accessories, or bundles simply because placing them together might consolidate traffic.
For operational work, default to the child ASIN. Advertising, inventory planning, replenishment, creator briefs, attribution tags, and direct product links should identify the exact buyable variation. The parent can remain in catalog governance records as the family-level reference.
The ASIN Integrity Check is a six-part prepublication framework for preventing catalog and campaign errors. Run it before creating a listing, importing a catalog, launching ads, or distributing product links to creators and affiliates.
An evidence record shortens troubleshooting by showing what was submitted, which identifiers were used, and whether the catalog still matches the physical product.
A correct ASIN is the join key between Amazon's catalog, seller offers, inventory, ads, analytics, and external traffic. Weak ASIN governance creates downstream errors even when the product copy and creative are strong.
The ASIN is therefore not an SEO keyword field or a barcode substitute. It is the catalog address through which Amazon's commercial systems find the product.
ASIN governance continues after listing creation. Every ad, creator brief, affiliate link, landing page, and analytics tag should route shoppers toward the intended buyable child ASIN.
Stack Influence is a micro-influencer marketing platform built around gifted-first product seeding, vetted creator activation, campaign coordination, UGC generation, and completed-post accountability. For an Amazon campaign, a strong product record includes the child ASIN, canonical product URL, variation name, current price, stock status, and approved messaging before creators publish.
This prevents a common failure: content features one variation while the link opens another. Sellers planning influencer partnerships for Amazon products should define a response if the featured child goes out of stock or loses eligibility. Teams learning how to collaborate with Amazon influencers can add the same check to creator instructions.
A verified Stack Influence case study for Targus recorded 120 creator promotions during a three-month new-product campaign. Average monthly unit sales increased from 56 at the starting point to 221 during the measured campaign period, while Best Seller Rank moved from #151,547 to #47,811. The result is a specific campaign example, not a forecast, and outcomes vary by product, category, pricing, marketplace conditions, creative quality, and execution.

Measure ASIN performance as a connected signal stack: catalog health, offer availability, traffic, conversion, advertising, external attribution, and marketplace outcomes. Review the exact child ASIN first, then roll results up to the parent family or brand only after confirming that every included variation is comparable and active.
Use the ASIN Signal Stack:
Amazon describes Amazon Attribution as a free measurement solution for eligible advertisers measuring non-Amazon channels, including social and influencer campaigns. Its reports use a 14-day attribution window and include clicks, detail page views, add-to-carts, purchases, units sold, and product sales.
Create separate tags for reporting by creator, channel, tactic, or creative, and select the exact promoted products during setup. Stack Influence's Amazon Attribution guide explains the workflow, while the Amazon Brand Referral Bonus guide covers referral credits in contribution analysis.
Use three review windows. Check the first seven days for broken links, wrong variations, stock problems, and tracking failures. Use the relevant attribution window for direct response, then review 30-to-90-day trends for catalog, rank, keyword, and repeat-purchase movement. Longer windows add context but also add more possible influences.
Most ASIN failures come from identity shortcuts. The fastest fix is to return to the physical product, its authorized identifier, and the exact catalog record.
A monthly catalog audit should flag duplicates, inactive children, mismatched images, stale URLs, missing inventory mappings, and campaigns pointing to discontinued variations. That maintenance protects shopper experience and reporting reliability.
An ASIN number is not merely a code to copy from an Amazon page. It is the catalog identity that connects the physical product to offers, variations, FBA inventory, advertising, external traffic, and performance reporting.
Start by matching the exact product, validating the GTIN, mapping every buyable child, and storing the identifiers in one source of truth. Once that foundation is stable, Amazon sellers can scale listing optimization, creator activation, paid media, and attribution with fewer routing errors and clearer product-level decisions.
For brands planning a creator or product-seeding campaign, the practical next step is to audit the child ASINs, stock status, destination links, and measurement tags before outreach begins. That preparation gives content creators a reliable product destination and gives the ecommerce team cleaner data after traffic arrives.
Retail arbitrage looks simple from the clearance aisle: buy a product below its marketplace price, list it, and keep the difference. For ecommerce sellers, the harder work begins after the scan. Fees move, competing offers multiply, inventory ages, returns arrive, and Amazon may request stronger sourcing documentation than a basic store receipt provides.
This guide explains how retail arbitrage works in 2026, how to evaluate products before buying them, which risks deserve the most attention, and how to measure real profit instead of attractive revenue.
Retail arbitrage is the practice of buying discounted products from physical stores and reselling them at a higher price through a marketplace such as Amazon. Profit is the remaining spread after marketplace fees, fulfillment, prep, shipping, returns, taxes, travel, and unsold inventory. It is a sourcing model, not a guaranteed-profit formula.
Amazon’s own reselling guidance describes retail arbitrage as purchasing products from retail stores at lower prices and reselling them for profit. The working process is straightforward: find a discounted item, match the exact listing, confirm selling eligibility, estimate all-in profit, and fulfill the order.
Retail arbitrage differs from three adjacent ecommerce models:
Retail arbitrage lowers the commitment required to test Amazon, but the seller has limited control over replenishment, price, documentation, and the product detail page.
Retail arbitrage is generally legal in the United States when a seller lawfully purchases authentic goods and resells them without misrepresentation. Legal resale rights do not override Amazon’s listing rules, brand restrictions, documentation demands, condition standards, safety obligations, or intellectual-property policies. A lawful store purchase can still create marketplace enforcement risk.
For copyrighted goods, the first-sale doctrine provides one legal foundation for resale. In the Supreme Court’s Quality King decision, the Court explained that the lawful owner of a copy may resell it after the first authorized sale. That principle does not protect counterfeit, altered, recalled, restricted, or inaccurately described inventory.
Amazon applies separate marketplace requirements. Its public reselling guide tells sellers to keep purchase orders, invoices, and transaction records, while Amazon’s invoice requirements for policy appeals explain that invoices help verify legitimate sourcing.
A retail receipt proves that a purchase occurred, but it may not establish the supply chain Amazon wants to verify during every authenticity, approval, or policy review. The risk is not that every retail-arbitrage listing will fail. The risk is buying inventory before discovering that the requested evidence is unavailable.
Treat documentation as a pre-purchase question. Preserve the full receipt, payment record, store location, purchase date, item photographs, UPC, model or lot information, and a clear mapping from each purchased unit to its ASIN. For brands or categories with stricter requirements, retail sourcing can still leave a proof gap.
Business compliance also varies by location. The U.S. Small Business Administration’s licensing guidance notes that required permits depend on business activity and location, including state, county, and city rules.
The Five-Gate Retail Arbitrage Buy Test prevents a strong-looking price spread from hiding a fatal weakness. Every product should pass Permission, Proof, Profit, Pace, and Exit before it enters the cart. One failed gate is enough to decline the purchase.
Confirm that your exact seller account can list the exact ASIN in the intended condition and fulfillment channel. Check category, brand, product, hazmat, expiration, and FBA restrictions. Opening a listing in a scanning app does not prove that your account can sell it.
Ask whether you could defend the product’s authenticity, condition, source, and quantity months later. Documentation should connect the purchased unit, listing, and payment record. Higher-risk inventory deserves stronger evidence, not merely a higher projected margin.
Calculate profit after purchase cost, sales tax when applicable, referral fees, fulfillment, inbound shipping, prep, labels, storage, returns, software, travel, and markdown risk. Run the calculation again at a lower selling price so a modest price drop does not turn the unit negative.
Estimate how quickly the inventory can convert back into cash. Review price history, offer count, sales-rank movement, seasonality, stock levels, and likely competition after the clearance deal spreads. A lower return that repeats quickly can be more useful than a larger return that takes a year.
Define the response if the item does not sell as expected. The exit might be a store return, controlled markdown, another marketplace, local sale, or liquidation. Record the return deadline and estimated downside before purchase, not after the listing stalls.
The framework changes the buying question from “Can this item make money?” to “Can I buy, prove, sell, and exit this item without exposing the account or trapping capital?”
Retail arbitrage has no universal startup cost because inventory, selling plans, supplies, travel, software, and fulfillment choices vary. A seller can begin with a small multi-SKU test, but the budget must also cover fees and a reserve for returns or markdowns. The right starting amount is risk capital, not essential-expense money.
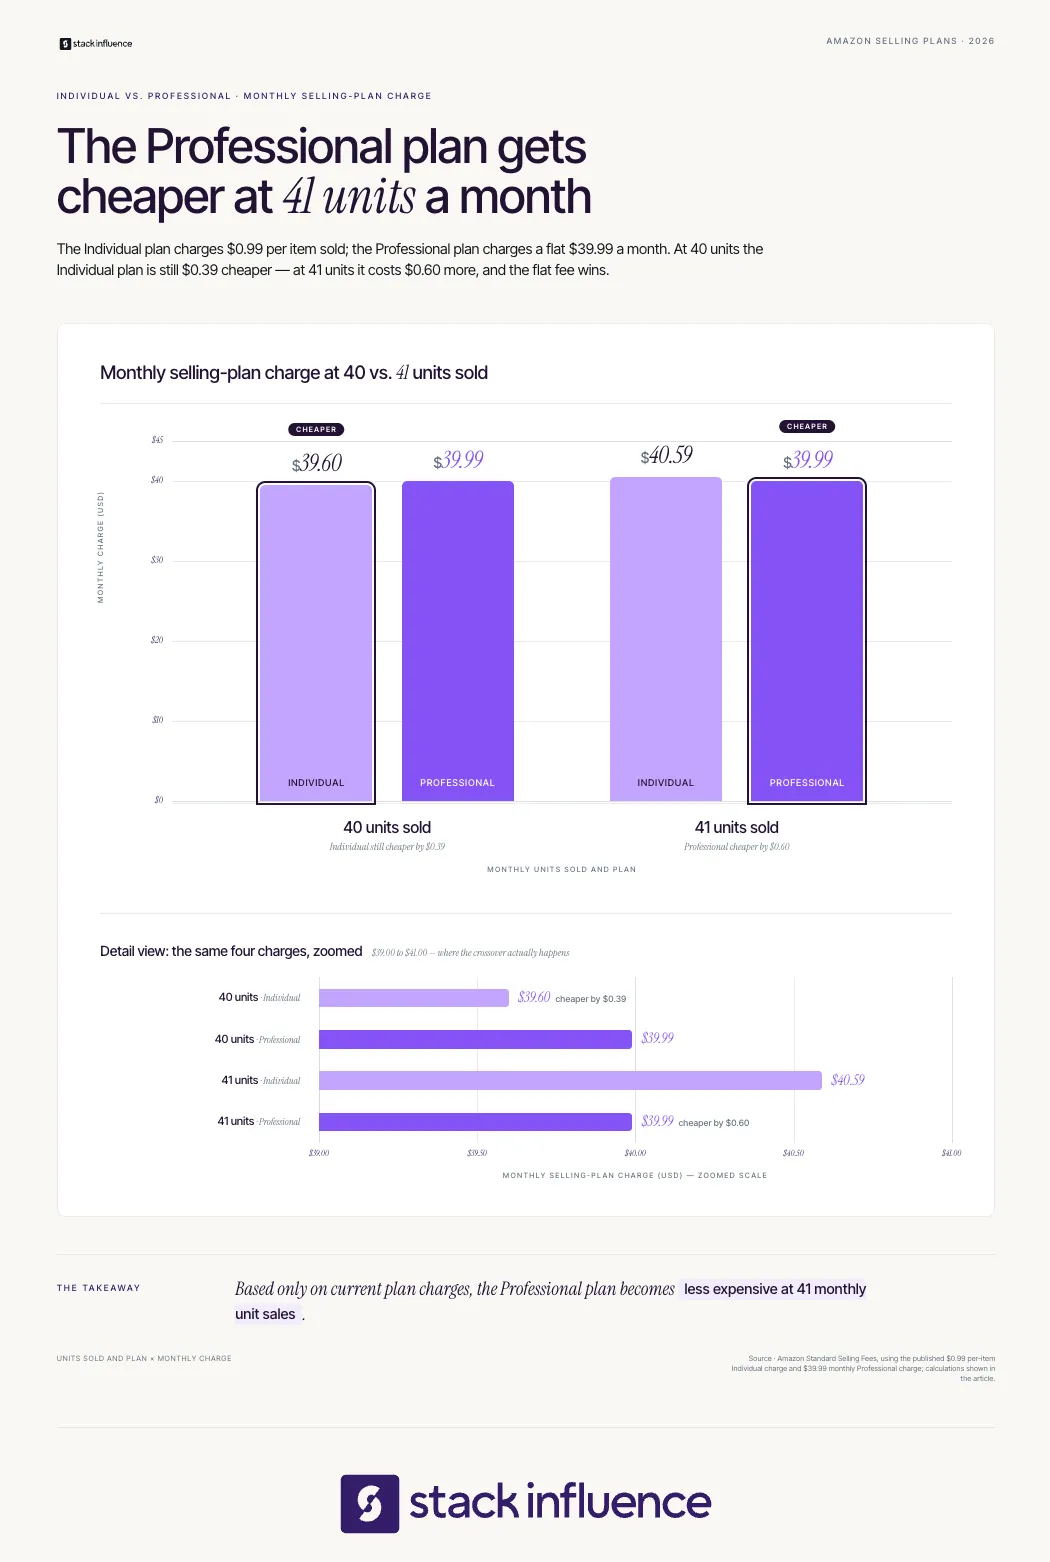
Amazon’s current selling-fee page lists an Individual plan at $0.99 per item sold and a Professional plan at $39.99 per month, before referral and optional service fees. Based only on those charges, 40 Individual-plan sales cost $39.60 and 41 cost $40.59, so Professional becomes cheaper at 41 monthly units.
Use this unit-profit formula:
Selling price minus product cost, nonexempt sales tax, referral fee, fulfillment, inbound freight, prep, labels, storage, return allowance, and allocated overhead equals expected net profit.
For example, a $30 sale with a $10 product cost, $8.50 in marketplace and fulfillment fees, $1.50 in prep and inbound shipping, and a $1 return or markdown reserve produces $9 in expected net profit. That is a 90 percent return on inventory cost and a 30 percent net margin on revenue. Use the live ASIN and fulfillment method for actual estimates.
Also track profit per sourcing hour, profit per route, travel cost, and inventory still unsold after 30, 60, and 90 days. This beginner’s guide to selling on Amazon covers the broader account and fee setup.
Start retail arbitrage by creating a compliant seller account, setting conservative buying rules, and testing a few units across several products. The first sourcing cycle should validate listing permission, documentation, fee estimates, sell-through, condition handling, and the complete cash-conversion process. Maximum revenue is not the goal of the first trip.
The IRS recordkeeping guidance advises businesses to retain supporting documents such as sales slips, bills, invoices, receipts, deposit records, and canceled checks. Keep searchable digital records that connect purchases, inventory, sales, and tax entries.
Sales-tax treatment requires separate attention. The Streamlined Sales Tax Governing Board’s exemption guidance explains that eligibility and registration rules vary by state. A resale certificate affects unit economics only when the seller qualifies and the retailer accepts it, so confirm local requirements with a qualified adviser.
Better retail arbitrage candidates are authentic, sealed, easy to match to an exact ASIN, permitted for the seller’s account, supported by defensible records, and profitable at a lower selling-price scenario. They also have understandable demand, manageable competition, low handling risk, and an exit route if the original estimate fails.
Look for six characteristics:
Use extra caution with ingestibles, topical products, batteries, hazmat goods, serial-numbered items, warranties, baby products, short-dated inventory, and listings with frequent counterfeit complaints. A two-pack is not interchangeable with a single unit, and a revised formula or model may require a different ASIN.
Fulfillment choice should follow the exact SKU economics. Through Fulfillment by Amazon, Amazon stores inventory, picks and packs orders, ships products, and handles customer service and returns. Costs vary by product and include fulfillment and storage charges.
FBA can suit standard-size, fast-moving products with enough margin to absorb its fees. Fulfilled by Merchant can preserve control for bulky, fragile, slow, or condition-sensitive inventory. Many sellers use both rather than treating fulfillment as one permanent account-wide choice.
This FBA versus FBM guide explains the operational differences in storage, shipping, control, Prime eligibility, and returns.
Retail arbitrage should be measured as an inventory and cash-flow system, not as a collection of exciting flips. The Four-Layer Arbitrage Scorecard connects unit profit to capital efficiency, inventory quality, and account safety.
Track actual net profit per unit, net margin, ROI on inventory cost, fee variance, and minimum safe price. Replace estimates with settlement data after each sale.
Measure 30-day sell-through, average days in inventory, cash-conversion time, profit per sourcing hour, and profit per route. These metrics show whether inventory is funding the next cycle quickly enough.
Monitor returns, stranded inventory, aged units, markdown losses, damage, and the share of purchases unsold after 30, 60, and 90 days. Revenue can increase while inventory quality declines.
Track documentation coverage, restricted-listing attempts, authenticity or condition complaints, recall checks, and unresolved account-health issues. A profitable SKU is not valuable when its records cannot support the business.
Review active prices daily, SKU performance weekly, sell-through at 30 days, and category performance every 90 days. Do not treat a price increase, rank change, or Featured Offer win as proof that one action caused a sale because competition, seasonality, stockouts, and fulfillment speed can change together.
Pricing automation helps only when the minimum price includes every real cost. This guide to Amazon repricer tools explains why minimum and maximum boundaries matter.
Retail arbitrage is difficult to scale because supply is inconsistent, sourcing consumes labor, competition compresses price, and retail documentation may be weaker than commercial invoices. Growth can add stores, buyers, vehicles, prep work, and cash tied in inventory before it creates a repeatable or transferable ecommerce asset.
Four constraints shape the model:
Scaling should improve systems rather than simply expand mileage. Standard procedures, buyer training, centralized prep, SKU purchase limits, documentation standards, and category specialization can increase consistency. Sellers should compare that added complexity with authorized wholesale or owned-brand economics.

Retail arbitrage can teach ASIN matching, fee analysis, fulfillment, inventory discipline, returns, repricing, and marketplace compliance through relatively small tests. The next model should be chosen according to the control the seller wants to gain.
Common progression paths include:
Creator marketing becomes more practical when the seller owns the brand or is authorized to market it. An owned-brand team can apply influencer product-seeding strategies and learn how to collaborate with Amazon influencers to support awareness, reusable UGC, and traffic around replenishable inventory.
Stack Influence is a micro-influencer marketing platform built around gifted-first product seeding, vetted creator activation, campaign coordination, UGC generation, and completed-post accountability. The workflow is designed for ecommerce brands moving from product availability to managed creator participation and content production.
Most retail arbitrage failures begin before purchase. The seller notices the current price gap but ignores the conditions required to collect it.
Avoid these mistakes:
The U.S. Consumer Product Safety Commission’s reseller guidance states that recalled products cannot legally be offered for sale and directs resellers to check its recall database. Marketplace policies also change, so review official notices and reliable monthly ecommerce seller updates instead of relying on a static sourcing checklist.
Retail arbitrage can help ecommerce sellers learn research, marketplace fees, fulfillment, inventory control, and cash-flow discipline with smaller commitments than many sourcing models. Its simplicity disappears when documentation, safety, returns, price competition, and unsold stock are ignored.
Evaluate 20 candidate products with the Five-Gate Retail Arbitrage Buy Test, then purchase only small quantities that pass Permission, Proof, Profit, Pace, and Exit. The results will show whether to keep refining arbitrage, move toward wholesale, or use the marketplace knowledge to build an owned brand.
Your competitors leave a visible trail across social media: the topics they repeat, the formats they favor, the creators they partner with, the ads they keep running, the questions customers ask, and the offers they push. Most teams collect this information without turning it into a decision.
A useful social media competitor analysis gives ecommerce brands, social media managers, and content teams a disciplined way to interpret that trail. The goal is to identify meaningful signals, reject distorted ones, and choose what deserves a controlled test on your own channels.
From Stack Influence’s campaign work, the most useful competitive reviews connect creative activity with creator participation, audience response, and commerce outcomes. This guide shows how to build that kind of system.
Social media competitor analysis is the structured process of comparing how selected brands earn attention, engage audiences, use paid and creator content, and move people toward a business outcome. A useful analysis normalizes time periods and metrics, separates observation from inference, and converts findings into testable decisions for your own channels.
A one-time audit produces a snapshot, while a recurring system reveals durable patterns. Competitor analysis should also extend beyond direct rivals to adjacent brands and accounts competing for the same audience attention.
Start with what social media analytics measures for ecommerce teams, then add a relevant external benchmark. Rival IQ’s 2025 benchmark report covers 2,100 brands across 14 industries, illustrating why industry context matters more than a universal “good engagement rate.”
The Competitive Signal Loop turns public social activity into decisions and prevents research without a clear business question.
The loop should repeat, not end. A lightweight content tracking system lets the team preserve observations, test results, and strategic decisions instead of restarting from zero every quarter.

Analyze a compact portfolio of competitors that explains both your commercial market and your audience’s attention market. A practical starting set includes three direct competitors, two adjacent brands, one attention leader, and one emerging challenger. The exact number matters less than choosing accounts that answer different strategic questions.
Use four competitor types:
Pair larger reference brands with closer operational peers. A global company’s media budget, celebrity access, or distribution advantage may make its visible results difficult to reproduce.
Ecommerce teams should connect social research with marketplace research. The same competitor may use creator videos to generate awareness, search ads to capture demand, and optimized marketplace listings to convert it. A broader Amazon competitor analysis can reveal whether the social strategy aligns with pricing, reviews, keywords, and product positioning.
Collect data that explains a competitor’s publishing system, creative choices, audience response, paid support, creator activity, and conversion path. Follower count alone is not enough. The evidence set should show what the competitor repeatedly does, how people respond, and what action the content appears designed to produce.
Capture the following fields for each account:
Use platform-native sources before relying on third-party estimates. Meta’s Ad Library shows ads currently running across Meta technologies, while TikTok’s Top Ads dashboard surfaces high-performing auction ads that can be filtered by variables such as region and objective. These tools help separate an organic content pattern from a creative idea receiving paid distribution.
LinkedIn Page admins can use competitor analytics to compare follower and organic content metrics and review trending competitor posts from the prior 30 days. On YouTube, the Audience tab can show what your own viewers watch outside your channel, which helps identify attention competitors and collaboration opportunities.
A guide to social media listening tools can help teams capture recurring complaints, category phrases, product requests, and shifts in audience conversation that profile metrics miss.
Normalization is what turns a spreadsheet into analysis. Without it, a team may compare a boosted video with an organic carousel, an established account with a new challenger, or a follower-based engagement rate with an impression-based rate and reach the wrong conclusion.
Use consistent formulas and label every denominator:
LinkedIn defines Page engagement rate as interactions divided by impressions, with interactions including clicks, reactions, comments, and shares. That definition should not be compared directly with a tool using followers as the denominator.
Apply the same discipline to trend data. Google explains that Google Trends data is normalized by time and location and then scaled from 0 to 100. It reflects relative search interest, not absolute search volume, and Google recommends treating it as one data point rather than proof that a topic is “winning.”
A useful social media analytics dashboard should record the formula, source, date range, and data-access limitation beside every metric. That small habit prevents false precision later.
Strong competitor analysis explains why a content pattern may work. It does not stop at “Reels performed well” or “this post went viral.” The analyst should code the strategic components inside the post.
Evaluate each content sample through eight lenses:
This coding method exposes reusable principles without copying surface details. The real lesson may be a fast demonstration, a specific objection, and a realistic use setting rather than a particular audio track or visual style.
For ecommerce teams, the broader ecommerce social media marketing workflow helps connect those creative choices to discovery and conversion. The relationship between micro-influencers and UGC in ecommerce is especially important because creator content can appear on creator profiles, brand feeds, ads, product pages, and marketplaces.
Turn every meaningful finding into a written hypothesis, a controlled test, a success rule, and a follow-up decision. A competitor pattern is not a strategy until your team explains why it may work for your audience and designs a test that can confirm, reject, or refine that explanation.
Use this four-part conversion:
For example, an observation might be that several competitors use customer-style product demonstrations in their most discussed posts. The hypothesis could be that realistic use reduces uncertainty better than polished product photography. The test would compare a creator-led demonstration with the brand’s standard creative while using the same product, offer, audience, and measurement window.
An influencer seeding workflow for ecommerce can turn that hypothesis into a repeatable creator test rather than a one-off post. The result should still be evaluated on its own evidence, not assumed from competitor performance.
Most basic audits undercount the system behind a competitor’s feed. A brand may support organic posts with paid media, distribute products to UGC creators, activate brand ambassadors, sponsor micro-influencers, syndicate creator content, or direct traffic to Amazon, Shopify, and retail partners.
Classify creator posts carefully. The FTC’s disclosure guidance for social media influencers states that a material connection can include payment, employment, a family relationship, or free or discounted products. Meta also requires the paid partnership label for organic branded content on Instagram. A visible disclosure is useful evidence, but the absence of one does not prove that a post had no commercial relationship.
Influencer marketing and competitor analysis intersect at the surrounding creator network. Track:
Stack Influence is a micro-influencer marketing platform built around gifted-first product seeding, vetted creator activation, campaign coordination, UGC generation, and completed-post accountability. Its workflow is designed for ecommerce brands that want to move from a competitive insight, such as insufficient real-world product demonstrations, into a structured creator-content program.
The Magic Spoon case study shows why the scorecard should extend beyond social engagement. During a 12-month hero-product campaign, 3,448 creator promotions generated 5.82 million social impressions and 211,000 engagements. Average monthly unit sales increased from 1,937 to 7,867 during the measured campaign period, while Amazon Best Seller Rank moved from #828 to #181. These outcomes occurred during the campaign and should not be treated as a forecast for another brand.
Additional Stack Influence customer stories show how creator volume, engagement, marketplace rank, and sales can be reported together.

Measure competitor performance with a four-layer scorecard covering delivery, resonance, intent, and business outcomes. Public competitor data is strongest at the first two layers and weakest at the final two. Treat unavailable conversion data as unknown, not as permission to invent an estimate or assume that visible engagement produced profit.
Use four measurement layers:
Attribution is strongest when your own campaign uses tagged links, platform reporting, creator-specific identifiers, controlled landing pages, and a defined baseline. The guide to tracking influencer-driven leads and sales explains how awareness and conversion signals can be connected without claiming that one visible metric caused the final result.
Use a 30-day view for creative decisions and a quarterly view for durable shifts in positioning, creator activity, channel investment, and customer conversation. Keep the windows consistent across competitors.
A 30-day cycle can establish a comparable baseline while producing an immediate content decision. Later cycles become faster once the competitor set, coding rules, formulas, and reporting format are established.
Choose one business question, such as which creative format to test for a launch or which audience objection deserves more content. Confirm the competitor set, platforms, date range, metric definitions, and your own baseline.
Collect the agreed content sample for every account. Code each post by topic, hook, format, proof, creator role, CTA, offer, and audience response. Save links and screenshots with dates because posts, captions, and ad status can change.
Calculate normalized metrics, identify repeated creative structures, read comments, and separate paid from organic signals. Prioritize patterns that appear across multiple posts or competitors rather than one viral outlier.
Run one or two focused experiments with predetermined success rules. Record what changed, what stayed constant, what happened, and what the team will do next. A clear reporting cadence is more valuable than a large dashboard nobody uses.
Keep the scorecard connected to the content calendar, creator pipeline, campaign briefs, and measurement dashboard.
The most damaging mistakes make a polished report look more certain than the evidence allows.
The purpose of social media competitor analysis is not to create a prettier benchmark deck. It is to reduce uncertainty before your team invests time, inventory, creator relationships, and media budget.
Choose a focused competitor set, collect comparable evidence, normalize the metrics, separate paid and organic activity, and turn the strongest pattern into a controlled experiment. For ecommerce brands that identify a creator-content gap, evaluating a managed Stack Influence product-seeding workflow can provide a practical next step toward vetted participation, completed UGC, and a more measurable campaign system.
An ecommerce brand can have a polished logo, a competitive product, and a full content calendar yet still sound interchangeable. The same problem affects content creators whose captions, pitches, and sponsored posts change personality every week. When the language is inconsistent, audiences must repeatedly work out who is speaking, what the speaker values, and whether the message feels credible.
Brand voice solves that problem by making communication recognizable without making every sentence identical. This guide shows ecommerce sellers and content creators how to define a voice, adapt it by situation, protect it across creator partnerships, and measure whether it improves recognition, clarity, trust, and commercial performance.
Brand voice is the consistent verbal personality a business or creator uses across communication. It governs word choice, sentence rhythm, point of view, humor, formality, and the values implied by a message. The voice stays recognizable, while tone changes to match the channel, situation, and audience's emotional state.
The American Marketing Association's branding definitions distinguish identity, positioning, and perception. Brand voice is the verbal layer that expresses those choices, determining whether a brand sounds practical, playful, exacting, reassuring, rebellious, or restrained.
Mailchimp's public voice-and-tone guide offers a useful distinction: voice remains relatively stable, but tone shifts with the reader's situation and emotional state. That is why a shipping-delay email should not sound like a product-launch caption, even though both should still feel as if they came from the same company.
Keep four related concepts separate:
This distinction becomes especially important when combining UGC and brand-generated content. Brand content can follow the company voice closely. Creator content should carry the same product truth and positioning while preserving the creator's own manner of speaking.
Brand voice matters because buyers and followers encounter a business through many disconnected moments. A recognizable verbal identity reduces friction across product pages, social posts, emails, support replies, creator videos, and marketplace listings. It also helps teams produce content faster because fewer decisions must be reinvented in every draft.
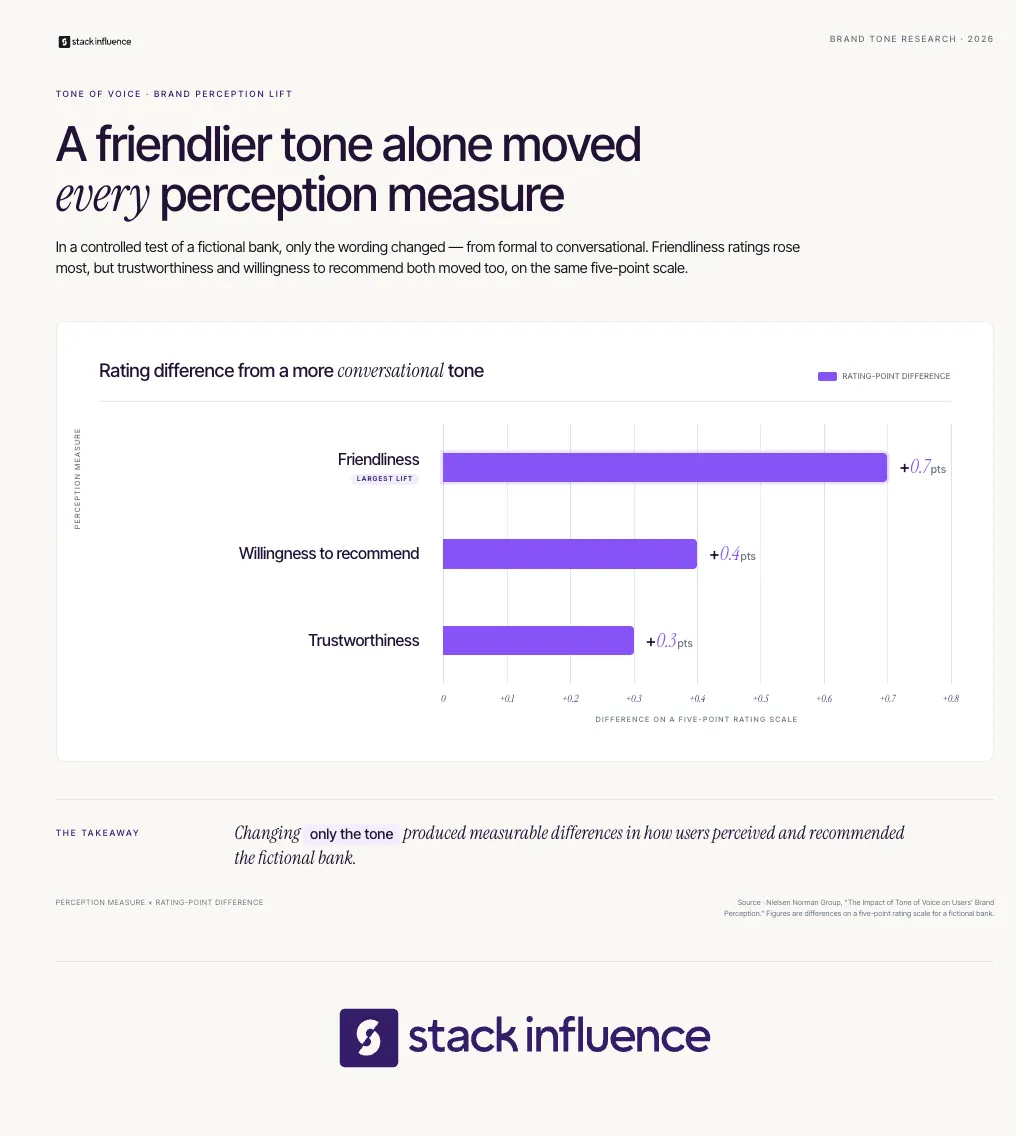
Nielsen Norman Group research on tone and brand perception found measurable differences in friendliness, trustworthiness, and willingness to recommend when only the wording style changed. In one bank comparison, a more conversational version increased friendliness by 0.7 points, trustworthiness by 0.3 points, and willingness to recommend by 0.4 points on five-point scales. The same research found that trustworthiness explained 52% of the variability in desirability, while friendliness added another 8%.
For ecommerce sellers and content creators, a useful brand voice creates five advantages:
The Brand Voice Operating System converts broad personality words into six components that guide content: audience reality, brand promise, personality boundaries, language rules, a tone matrix, and governance. Each component answers a different production question, so the system remains useful when a brand adds new products, channels, employees, agencies, or creator partnerships.
Design the voice around the audience's language, knowledge, concerns, and buying situation. Review support tickets, product reviews, search queries, creator comments, sales calls, and interviews. Record what people misunderstand, what creates hesitation, and what proof changes their mind.
The goal is not to imitate every phrase. It is to choose the clarity, formality, and reassurance the audience needs. The federal government's plain-language guidance similarly emphasizes writing for a specific audience and testing whether that audience understands the content.
The brand promise states the dependable change the product or creator helps the audience make. It should be narrower than a mission statement and more durable than a campaign slogan. A cookware seller might promise tools that make everyday cooking less complicated.
Use the promise to filter language. Dense technical phrasing contradicts a promise of simplicity, while vague superlatives weaken a promise of expertise. Every voice rule should make the promise easier to believe.
Choose three traits, then define what each is and is not. “Helpful, not patronizing,” “confident, not absolute,” and “playful, not careless” give contributors boundaries instead of vague adjectives.
Nielsen Norman Group's four tone-of-voice dimensions offer a calibration tool: formal or casual, serious or funny, respectful or irreverent, and matter-of-fact or enthusiastic. Place the brand on each spectrum, then note how it should shift in high-stakes situations.
Language rules translate personality into observable choices. Specify sentence length, point of view, contractions, technical vocabulary, capitalization, product terminology, banned clichés, and when humor is appropriate.
Microsoft's brand voice guidance shows how broad traits become concrete practices, including leading with the key point, using everyday words, avoiding jargon, and making next steps obvious.
Useful rules might include:
A tone matrix shows how the stable voice changes by situation. Record the audience's likely state, the goal, the tonal adjustment, and anything to avoid.
For example:
A voice guide needs an owner, approved examples, a revision process, and a record of what the team learns. Store strong and weak samples from product pages, emails, support replies, creator posts, and ads.
Review the guide quarterly or after a major audience, product, or positioning change. Update it when repeated evidence shows audience confusion, inconsistent interpretation, or a genuinely new communication context.
A usable brand voice guide should fit on one page before it expands into a larger style system. It needs enough detail to guide a writer or creator without requiring a branding workshop. Include the audience, promise, three bounded traits, language rules, tone shifts, approved examples, prohibited claims, and an owner.
Use this structure:
Consider a refillable home-care brand with three traits:
“Refill the bottle in under a minute and reuse it for the next clean” fits those traits. “Transform your entire life with our revolutionary refill” is inflated and asks the reader to accept more than the product proves.
For creator campaigns, convert the guide into an influencer brief. During the influencer outreach process, explain the product truth, audience, deliverable, rights, disclosure requirement, approval process, and creative freedom before acceptance.
The strongest creator brief locks the truth and releases the phrasing. The brand controls accurate product information, disclosures, prohibited claims, and the campaign objective. The creator controls the hook, pacing, examples, visual style, and natural vocabulary.
TikTok's analysis of more than 300 top Creator Marketplace videos found that high-engagement creator work tended to avoid rigid scripts, use a natural hook, apply trends selectively, and match the right community. The operational lesson is broader than TikTok: creator partnerships become less believable when the brand's preferred phrasing replaces the creator's established communication style.
Use three control layers:
Disclosure belongs in the fixed layer. The FTC endorsement and disclosure guidance explains that material connections between brands and endorsers should be disclosed clearly. A gifted product can create such a connection, so disclosure language should be planned before content is produced rather than added as an afterthought.
This balance is especially important in influencer seeding, where the product itself is part of the value exchange. A repeatable influencer marketing strategy should preserve creator credibility while keeping claims, rights, logistics, and measurement consistent.
Stack Influence is built around gifted-first product seeding, vetted micro-influencer activation, creator coordination, UGC generation, and completed-post accountability. With roughly 600,000 vetted creators, concise message guardrails are more useful than scripting every individual expression.
During a verified 12-month Magic Spoon campaign, 3,448 creator promotions generated 5.82 million social impressions and 211,000 engagements, while average monthly unit sales increased from 1,937 to 7,867 during the measured period. The case study does not isolate brand voice as the cause, but it illustrates why scaled creator programs need messaging that survives many individual interpretations.

Brand voice should remain recognizable across channels, but its tone, density, structure, and pacing should change. A product page needs evidence and scanning clarity, while a short-form video needs a fast hook and natural speech. The governing personality stays stable; the delivery adapts to the audience's task and emotional state.
Use channel-specific rules:
A Shopify influencer marketing program may send audiences from creator content to a storefront, landing page, email sequence, and retargeting ad. The words should not be identical at every stage, but the promise, terminology, evidence standard, and personality should feel continuous.
Measure brand voice as a chain of effects rather than a single KPI. Start with whether people recognize the speaker and understand the message, then evaluate resonance, commercial behavior, and production efficiency. Use controlled tests and qualitative feedback because clicks or sales alone cannot explain whether the voice itself created the difference.
The Voice Measurement Stack includes five layers:
A creator or seller can organize performance in a social media analytics dashboard, while keeping sponsored, organic, affiliate, and brand-owned content in separate benchmark groups. A content tracking workflow should record the voice version, hook, format, audience, rights, and outcome.
Use a simple test protocol:
Treat correlation carefully. A creator post can coincide with higher traffic, sales, or marketplace rank without proving that wording caused the result. Brand voice measurement is strongest when controlled experiments, qualitative evidence, and commercial data point in the same direction.
Most brand voice failures come from weak implementation rather than a lack of creativity. Avoid these recurring problems:
The corrective principle is simple: define the stable truth, specify observable language choices, adapt tone to context, and keep learning from real audience response.
A small ecommerce team or independent creator can build and deploy a credible voice system in one month.
Collect 20 to 30 assets across product pages, emails, captions, support replies, creator collaborations, and ads. Mark what sounds distinctive, what creates confusion, and where the personality changes without a strategic reason.
Write the audience reality, promise, three bounded traits, language rules, tone matrix, and approved examples. Ask people outside the writing team to describe the personality they perceive.
Rewrite one product page, email, support reply, social post, and creator brief. Test recognition, comprehension, and performance where practical, then record disagreements that reveal unclear rules.
Publish the guide, assign an owner, update templates, and brief employees, freelancers, agencies, and creators. Schedule a quarterly review and define which measurements will trigger an update.
A strong brand voice is not a collection of clever phrases. It is a repeatable system that helps ecommerce sellers and content creators express a clear promise with recognizable personality, appropriate tone, credible evidence, and less production friction.
Start by auditing 20 existing assets, defining three traits with boundaries, and building a tone matrix for the moments your audience experiences most often. Then test the system on one product page and one creator brief. Once the language holds together at small scale, use it to guide product seeding, UGC, brand partnerships, and every customer touchpoint that follows.
This article was last updated on July 30th, 2026.
Social platforms have rewritten their rules more times in 2026 than most creators can keep track of, and the ones who spot each change first are the ones who ride it before everyone else catches on. A single algorithm tweak or new monetization feature can reshape what gets reach and what gets buried in a matter of days.
This is our running record of every major social media change in 2026, updated all year with the latest platform news, feature releases, and creator economy trends. Newest updates sit at the top, so you can scan what just happened or scroll back through the full year.
Want the biggest moves as they break? The Creator Chronicle drops every Thursday. Subscribe and get it in your inbox first.
The social media landscape will keep shifting through the rest of 2026, which is exactly why this page exists. Bookmark it and check back throughout the year for every platform update, algorithm change, and creator economy trend as it happens, all in one place.
If part of your growth plan is landing brand collaborations, Stack Influence matches creators with brands through gifted product campaigns, no paid sponsorships, just free products in exchange for authentic content. It is one more way to turn a growing audience into real partnerships.
Get the biggest moves before they hit this page: subscribe to the Creator Chronicle, every Thursday. 🫶
This article was last updated on July 23rd, 2026.
Social platforms rewrite their rules constantly, and the creators who spot a change first are the ones who ride it before everyone else catches on. A single algorithm tweak or new monetization feature can reshape what gets reach and what gets buried in a matter of days.
This guide is updated every week with the latest social media news, feature releases, and creator economy trends, so you have one place to check what actually moved. New items go to the top as they happen.
Want it before it lands here? The Creator Chronicle drops every Thursday with the week's biggest platform shifts. Subscribe and get it in your inbox first.
Also worth bookmarking:
Social media news moves faster than any single creator can track alone, which is exactly why this page exists. Bookmark it and check back each week for the latest platform updates, algorithm shifts, and creator economy trends before they filter out to everyone else.
If part of your growth plan is landing brand collaborations, Stack Influence matches creators with brands through gifted product campaigns, no paid sponsorships, just free products in exchange for authentic content. It is one more way to turn a growing audience into real partnerships.
Get the week's biggest moves before they hit this page: subscribe to the Creator Chronicle, every Thursday. 🫶
This article was last updated on August 2nd, 2026.
Marketplace rules and platform features shift almost weekly, and a single title-length cap or fee change can quietly erode margin or bury a listing that was ranking fine yesterday. Staying current is how sellers protect both their profit and their search position.
This guide is updated every week with the latest eCommerce news and seller-relevant platform changes, from Amazon seller news to TikTok Shop updates and broader eCommerce trends. New items land at the top as they break.
Want these updates delivered as they happen instead of waiting for them to hit this page? Subscribe to The Merchant Memo and get it in your inbox first.
Also worth bookmarking:
This page grows every week, so the deeper into the year we get, the more useful it becomes as a single scan of the marketplace, fee, and platform changes that actually move the needle for sellers. Bookmark it and check back after each weekly update lands.
If you're a seller looking to fill the gap between organic reach and paid ads, worth noting: Stack Influence connects Amazon and Shopify brands with everyday creators for gifted-product collaborations, a workflow that touches several of the trends covered above, from social platforms becoming commerce channels to brands leaning harder on creators for distribution.
Want every update like this as it happens, rather than waiting for it to hit this page? Subscribe to The Merchant Memo for the weekly version.
Content creators rarely lack data. Instagram, TikTok, YouTube, affiliate programs, brand portals, and storefronts all produce numbers. The real problem is turning those disconnected numbers into decisions. A social media analytics dashboard should show what to repeat, what to stop, how your audience is changing, and whether attention is becoming income.
This guide explains how to build a creator-first dashboard that supports content planning, audience growth, brand deals, UGC work, affiliate revenue, and long-term creator partnerships. The goal is not to collect every available metric. It is to create a compact decision system you will actually use.
A social media analytics dashboard is a recurring view of the metrics that help a creator evaluate content, audience growth, traffic, and income. Unlike a one-time campaign report, a dashboard updates over time and should make the next decision obvious, such as which format, topic, hook, platform, or partnership deserves more effort.
Understanding what social media analytics are is the foundation, but a dashboard is the operating interface. It may be a spreadsheet, a visual report, or connected software.
Native analytics should remain the source of truth for platform-specific performance. Instagram Insights helps creators evaluate followers and content performance, TikTok Studio provides content management and performance insights, and YouTube Analytics separates reach, engagement, audience, revenue, and trend information. A creator dashboard brings selected signals from those systems into one repeatable view.
A dashboard is also different from a sponsor recap. Your internal dashboard helps you make decisions every week. A creator-focused social media analytics report template packages selected results for a brand after a campaign, usually with deliverables, audience fit, performance, commercial signals, and recommendations.
The Creator Signal Stack prevents a common reporting mistake: treating likes, views, clicks, and revenue as if they describe the same thing. They represent different stages of performance. A useful dashboard keeps five signal layers visible so a creator can diagnose where a post succeeded, where it stalled, and what to test next.
Exposure shows whether content was distributed. Track reach, impressions, views, and the percentage of viewers who were followers versus nonfollowers when available.
Do not treat reach and impressions as interchangeable. Reach usually reflects unique accounts, while impressions or views can include repeated exposure.
Attention shows whether people stayed long enough to receive the idea. Track average watch time, completion rate, retention at key moments, and early drop-off for video.
TikTok defines video completion rate as completed views divided by total views, while YouTube provides average view duration and audience-retention reporting. Those metrics are more useful than views alone because a strong hook with weak retention requires a different fix from weak initial distribution.
Resonance shows whether the content felt useful, relatable, entertaining, or worth passing along. Track saves, shares, meaningful comments, replies, and engagement rate.
Likes can still provide context, but saves and shares often carry more diagnostic value for tutorials, product demonstrations, checklists, and opinion content. Read the comments as qualitative data too.
Action shows whether viewers moved closer to a relationship or purchase. Track profile visits, follows, website clicks, email signups, affiliate-link clicks, code uses, and conversions where attribution is available.
Use actions that match the post’s purpose. A discovery video may be successful because it creates profile visits and follows, while a product review may be judged by outbound clicks and attributed orders.
Commercial proof shows whether creator activity is becoming a durable business. Track sponsored revenue, affiliate revenue, platform payouts, UGC fees, repeat brand deals, approved assets, renewal rate, and revenue per production hour.
For UGC creators, commercial proof may exist even when the content never appears on the creator’s own account. Asset acceptance, revision rate, delivery speed, licensing value, and repeat briefs can matter more than follower growth.
The best version of the Creator Signal Stack uses one primary metric and no more than two diagnostic metrics per layer. A compact dashboard makes weak links in the performance chain easier to see.

A creator dashboard should include a small set of raw totals, normalized rates, benchmarks, and commercial outcomes. At minimum, track exposure, retention, high-intent engagement, audience growth, tracked traffic, and revenue. Add metrics only when they answer a recurring question or support a sponsor, affiliate, or content decision.
Use formulas that preserve context:
Always label the denominator. “Engagement rate” may mean interactions divided by followers, reach, impressions, or views, depending on the platform or tool.
Use medians alongside averages. One viral post can make a month’s average look healthy even when most content declined. A rolling median for the last 10 to 20 comparable posts gives a more honest baseline for pitches, forecasting, and experimentation.
Build a social media analytics dashboard by defining the decisions first, standardizing the data, collecting only necessary metrics, and adding a written interpretation layer. A creator can begin with native exports and a spreadsheet, then move to automated visualization once manual updates become frequent, slow, or error-prone.
A practical secondary structure is the Three-View Dashboard. The Content Lab tab supports weekly creative decisions, the Audience Asset tab tracks who is joining and returning, and the Commercial Proof tab records revenue, campaign delivery, UGC assets, and partner outcomes.
Creators should compare performance within the same platform and content format before making cross-platform judgments. Use consistent post ages, normalized rates, and rolling medians. Cross-platform totals can inform resource allocation, but they should not be blended into one score because networks define views, reach, retention, and engagement differently.
Apply five comparison rules:
YouTube’s own analytics guidance recommends comparing similar formats because audience behavior differs across videos, Shorts, and live content. The same principle belongs in a multi-platform creator dashboard: normalize the context before interpreting the result.
Never add followers from multiple platforms and call the total “unique audience.” The same person may follow you in several places. Report channel audiences separately unless you have a reliable deduplication method.
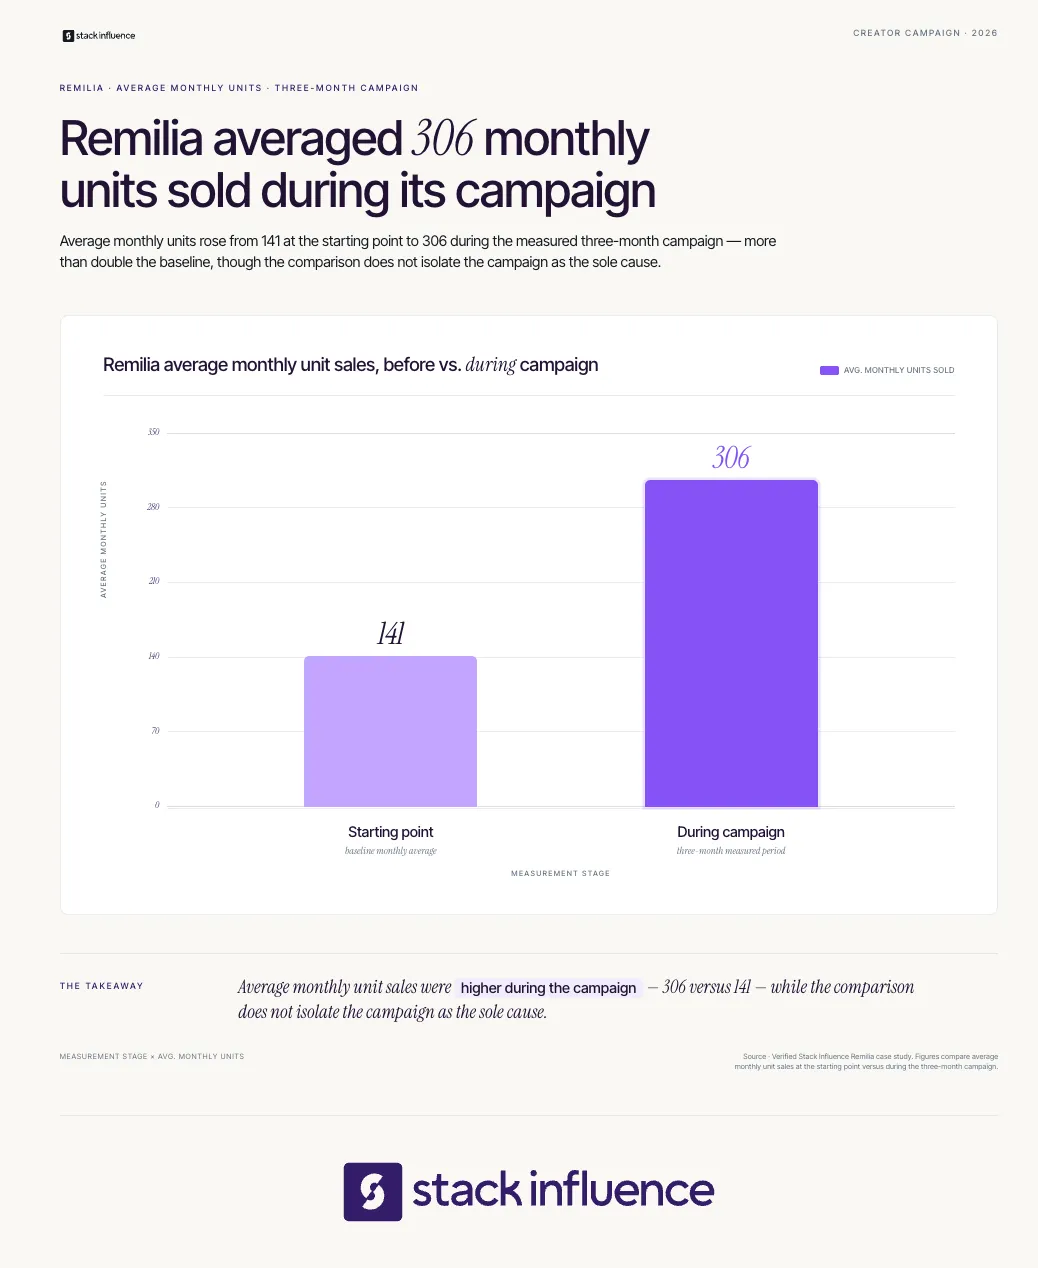
Creator analytics becomes commercially useful when it explains value in a format a brand can act on. A sponsor does not need your entire internal dashboard. It needs a clean view of what was delivered, who the content reached, how the audience responded, what action occurred, and what should happen next.
A strong sponsor view includes:
The same structure strengthens influencer marketing KPI discussions and improves content tracking across longer campaigns. It also gives creators stronger evidence when applying the brand deal tactics used by small creators.
Managed campaign workflows add an operational layer to the dashboard. Stack Influence is built around gifted-first product seeding, vetted micro-influencer activation, creator coordination, UGC generation, and completed-post accountability for ecommerce campaigns.
The creator’s post metrics still explain audience response, while campaign systems track participation, deliverables, and completion.
During a three-month Stack Influence campaign for Remilia, 115 creator promotions recorded 1.66 million social impressions and 73,832 engagements. Over the same measured period, average monthly unit sales moved from 141 to 306 and Amazon Best Seller Rank moved from #78,412 to #49,807.
These aggregate results do not prove that any individual post caused the marketplace changes. They show why delivery, audience response, and business outcomes should remain separate dashboard layers. Results vary by product, category, pricing, market conditions, creative quality, and execution.
Creators producing content for a brand’s channels should also document non-public value. The content creator’s guide to UGC marketing explains why UGC work is often evaluated through asset performance and commercial use, while guidance on getting brand deals on TikTok and Instagram shows how affiliate, ambassador, and content-only work can build a track record.
Ask brands for performance feedback when possible, but never invent results you cannot access.
Choose native analytics when you manage few channels, a spreadsheet when you need custom formulas and low-cost control, and connected software when recurring exports consume too much time. The right setup depends on channel count, reporting frequency, historical access, sponsor requirements, collaboration needs, and whether you must connect social activity to web or revenue data.
Native dashboards provide the closest view of platform-specific metrics and usually require no additional software. They are practical for creators who publish on one or two channels and can review each platform separately.
The tradeoff is fragmentation. Native dashboards rarely create one consistent multi-platform history, and export options, date ranges, metric names, and retention windows can differ.
A spreadsheet gives creators full control over calculations, tags, benchmarks, and commercial data. It is especially useful when affiliate income, UGC fees, sponsorships, platform payouts, and production hours must sit beside social metrics.
The tradeoff is maintenance. Manual exports and copy-paste workflows can create stale data or entry errors, so the sheet needs a fixed update routine and validation rules.
Connected tools reduce collection work and make cross-network reporting easier. Hootsuite Analytics combines major networks and report exports, Buffer Insights focuses on cross-channel performance and creator-friendly takeaways, and Sprout Social analytics supports customizable, shareable dashboards and deeper reporting workflows.
The tradeoff is that third-party tools depend on the data and refresh schedules available from each network. Before choosing one, verify supported accounts, post-level history, export formats, formula controls, attribution connections, data latency, and whether you can retain your own historical dataset.
Hootsuite, for example, notes that refresh timing varies by network because third-party dashboards rely on native platform updates.
A dashboard works best when each review has a different job. Checking everything every day encourages overreaction, while checking only once a quarter hides useful patterns.
Do not change strategy because one post underperformed. Look for repeated movement across comparable posts, then test one variable at a time. The dashboard should reduce emotional decision-making, not create more of it.
The most damaging dashboard errors are usually structural rather than technical:
A useful dashboard is not the one with the most widgets. It is the one that helps a creator make a better decision faster and explain that decision to a brand, collaborator, or future self.
A social media analytics dashboard should function as a creator’s decision system, not a museum of past numbers. Start with the Creator Signal Stack, establish a 30-day baseline, and add only the metrics that improve content, audience, partnership, or revenue choices.
Use the first version in your next weekly review and your next brand pitch. Over time, the dashboard becomes evidence of creative judgment, audience understanding, reliable delivery, and commercial value, which is far more useful than follower count alone.
B2B influencer marketing fails when brands treat expert credibility like rented ad inventory. A creator may reach thousands of people, but the campaign has little commercial value if those people are not involved in the buying decision or the content does not help them evaluate the offer.
For ecommerce sellers and content creators, the opportunity is broader than software promotion. B2B creator partnerships can support wholesale growth, agency relationships, professional-use products, Amazon seller tools, Shopify apps, logistics services, and other offers sold to businesses. This guide explains how to select credible creators, design useful content, manage product seeding, and connect influence to pipeline and revenue.
B2B influencer marketing is the practice of partnering with credible experts, practitioners, customers, or creators to influence a business purchase. The creator’s role is to educate, reduce perceived risk, and help a buying group evaluate a product or service. The intended buyer, not the fact that a brand pays a creator, makes the campaign B2B.
That distinction matters for ecommerce. An Amazon seller sending a skincare product to an Instagram creator to reach consumers is running B2C influencer marketing. A packaging supplier partnering with an Amazon FBA educator to reach sellers is running B2B influencer marketing. A hybrid brand may run both programs at the same time.
B2B influencers may be consultants, founders, analysts, customer champions, newsletter writers, podcasters, community leaders, employees, or niche content creators. Their authority usually comes from demonstrated experience and audience trust rather than celebrity status. Stack Influence’s guide to B2B influencer marketing for ecommerce sellers and creators explores this trust-transfer model in more detail.
For content creators, the commercial opportunity is to own a specific business problem. “Ecommerce creator” is broad. “Amazon catalog specialist who explains variation strategy to beauty brands” gives brands a clearer reason to sponsor, brief, and measure the partnership.
B2B influencer marketing works differently because business purchases usually involve more stakeholders, more risk, and a longer evaluation process than consumer purchases. Reach still matters, but audience relevance, expertise, evidence quality, and the creator’s ability to answer objections matter more. The strongest content helps buyers justify a decision internally.
LinkedIn’s 2025 B2B creator research found that 82% of surveyed buyers said creator content directly influenced decisions, 87% preferred credible content from industry influencers, and 79% engaged with creator content at least monthly. The findings support a practical conclusion: B2B buyers use creator content as decision support, not merely entertainment.
The creator economy is also becoming a formal media category. The IAB’s 2025 creator economy report projected U.S. creator ad spend at $37 billion in 2025 and $44 billion in 2026. Those figures cover the broader creator market, not B2B alone, but they explain why brands increasingly expect professional selection, rights management, and measurement.
The practical differences are clear:
The Decision-Path Framework starts with the purchase decision and works backward to the creator, content, distribution, and measurement plan. This prevents a common mistake: choosing a popular creator first and inventing a campaign afterward.
Name the exact action the campaign should support. “Build awareness” is too vague. Better decisions include joining a wholesale program, requesting a demo, trialing a fulfillment service, switching ecommerce software, approving a professional-use product, or visiting an Amazon storefront.
Then identify the people involved and the objections each person may raise. A founder may care about growth, an operations lead about implementation, and finance about payback. One campaign can address several roles, but each asset should have one primary audience and one primary question.
Find the people the buyer already consults. Search LinkedIn discussions, YouTube channels, newsletters, podcasts, communities, webinars, conference agendas, and customer conversations. Stack Influence’s guide to LinkedIn micro influencers is useful when professional context matters more than broad consumer reach.
Do not limit the search to people who call themselves influencers. A practitioner with 3,000 relevant followers can be more valuable than a general-business creator with 100,000 followers. In B2B, audience-role density often matters more than total audience size.
Assign each piece of content to one stage of evaluation:
A repeatable influencer marketing strategy should specify the content job before the brief is written. This protects the creator’s voice while preventing vague posts that generate attention without helping a buyer act.
Decide how buyers will move from content to the next useful step. The path may lead to a guide, webinar, product page, demo, affiliate offer, Amazon listing, or sales conversation. Use one clear call to action per asset and give each creator a trackable destination.
Organic distribution can be extended through email, sales enablement, partner channels, and paid amplification. On LinkedIn, Thought Leader Ads allow advertisers to promote eligible member posts with the author’s permission for supported campaign objectives.
Treat the first activation as a test of fit, not the entire relationship. Capture what the creator learned, which objections appeared in comments, which formats held attention, and which audience segments responded. Then turn strong one-off collaborators into recurring experts, affiliates, brand ambassadors, or co-creators.
TopRank Marketing’s 2025 B2B influencer research found that 43% of respondents reported outstanding results, rising to 79% among marketers with mature programs. The study does not prove that duration alone causes better outcomes, but it reinforces the value of operational maturity and ongoing relationships.
Brands should choose B2B influencers by measuring buyer relevance and credibility before audience size. A useful creator has meaningful access to the roles involved in the purchase, demonstrated expertise, a clear content style, and dependable execution. Follower count is a screening signal, not a substitute for fit.
Use a 100-point Creator Fit Score:
A score of 75 or higher is a strong pilot candidate. A score from 60 to 74 may justify a smaller test or relationship-building period. Below 60, the brand should usually keep researching rather than forcing a partnership.
Brands can source manually, use influencer marketing platforms for discovery, engage an influencer marketing agency for strategy, or use a managed workflow for execution. Choose according to the bottleneck: research, influencer outreach, product fulfillment, creator coordination, content rights, or reporting.
The review should include comment quality, not just engagement rate. Look for questions from target buyers, peer discussion, saves, reposts, and evidence that the creator changes how people think. Then use a concise influencer outreach process that explains the audience, decision problem, deliverable, compensation, timeline, rights, and measurement plan.
For creators, the same scorecard works in reverse. Show brands who follows you, which business problem you own, what content you can produce, and how previous work affected qualified conversations or buyer behavior. That evidence is more persuasive than describing yourself as a general content creator.
The best format is the one that helps a buyer evaluate the offer and gives the brand a reusable asset. B2B influencer campaigns do not need to look like polished endorsements.
Separate content creation from distribution. A UGC creator may produce a strong tutorial for the brand’s product page, sales deck, or ads without posting it to a large personal audience. An influencer supplies both content and access to an audience. Stack Influence’s overview of UGC for ecommerce explains how creator assets can support owned and paid channels after the original collaboration.
For Shopify brands, Shopify Collabs can support direct creator invitations, gifts, discount codes, affiliate tracking, and payments. It is one example of how creator partnerships can combine content with performance-based economics.
Every paid, gifted, affiliate, employment, or other material relationship needs appropriate disclosure. The FTC’s endorsement guidance tells brands and creators to make the relationship clear, and free or discounted products can count as a material connection. Disclosure requirements belong in the brief, but creators should also understand their own responsibilities.
A B2B campaign can reach the visible user and still lose the deal because an unseen stakeholder remains unconvinced. The creator brief should therefore address both the champion who wants the product and the hidden buyer who can slow or reject the purchase.
The 2025 Edelman-LinkedIn B2B Thought Leadership Impact Report found that 64% of target decision-makers and 63% of hidden decision-makers in its U.S. survey spent more than an hour per week consuming thought leadership. It also found that 91% of hidden decision-makers associated quality thought leadership with uncovering needs they had not recognized, compared with 81% of target decision-makers.
The operational response is simple: create one asset for product enthusiasm and another for internal confidence. A demo may win the user, while an implementation checklist, risk breakdown, or business case helps the user persuade finance, operations, or leadership.
Measure B2B influencer marketing as a chain of contribution from content delivery to revenue, not as a single last-click event. Track qualified attention, intent signals, influenced accounts, pipeline movement, closed revenue, and reusable content value. Use a reporting window at least as long as the normal sales cycle.
Use the B2B Influence Contribution Stack:
Set up creator-specific links before launch. Google Analytics campaign parameters can identify referral source, medium, campaign, and creative in acquisition reporting. Pair those links with CRM campaign IDs, a consistent “How did you hear about us?” field, and sales notes that identify creator-assisted conversations.
Amazon sellers can use Amazon Attribution to measure eligible non-Amazon channels, including social, video, and affiliate or influencer campaigns. Amazon’s current documentation lists engagement and conversion metrics such as clicks, detail-page views, add-to-carts, purchases, units sold, and product sales, with a 14-day attribution window.
Interpret results in three windows. Review delivery and content quality during the first 7 to 30 days, intent during the next 30 to 90 days, and pipeline or revenue across at least one normal sales cycle. These are operating guidelines, not universal benchmarks.
Do not equate influenced pipeline with caused revenue. Creator content can contribute to a decision without receiving last-click credit, while broad “influence” reporting can also claim deals the campaign barely touched. Use multiple signals and explain the attribution method in every report.

Ecommerce brands often combine a B2B trust program with a consumer-facing micro influencer campaign. The B2B layer reaches retailers, agencies, professional users, or ecosystem partners. The consumer layer generates product demonstrations, social proof, UGC video, and marketplace traffic.
Stack Influence is built around gifted-first product seeding, vetted micro influencer activation, creator coordination, UGC generation, and completed-post accountability. Supplied company data describes a network of roughly 600,000 vetted creators and a completions-only model, sometimes called “influencer insurance,” in which platform spend is tied to completed creator posts.
This workflow is especially practical when a team wants to move from creator sourcing to shipped products, verified posts, and reusable content without managing every follow-up manually. Brands can review Stack Influence’s influencer seeding workflow, managed micro influencer campaign process, and content syndication options when planning that execution layer.
A verified Stack Influence example shows the difference between evidence and overclaiming. During a three-month Targus product campaign, 120 creator promotions generated 275,560 social impressions and 4,323 engagements, while average monthly unit sales increased from 56 to 221 during the measured period. The campaign was an ecommerce activation, not a pure B2B demand-generation benchmark, so it demonstrates execution scale rather than a guaranteed B2B outcome.
Most failures begin before the post is published.
B2B influencer marketing works when credible people help business buyers make a difficult decision with greater confidence. For ecommerce sellers, that can mean reaching wholesale partners, professional buyers, agencies, or the software and service ecosystem around commerce. For creators, it means turning expertise into useful evidence rather than chasing broad attention.
Start with one buying decision, one creator cluster, one content job, and one attribution path. Then use the first campaign to build a repeatable system for stronger creator partnerships, reusable content, and better-informed buyers. A managed product-seeding workflow can support that next step when campaign volume and follow-up become too complex to coordinate manually.
Influencer outreach fails when it is treated as a writing exercise instead of a matching and execution system. Ecommerce sellers often send polished messages to poorly matched creators, while content creators pitch brands without showing why their audience, concept, or skills fit the campaign.
Effective influencer outreach solves both problems. It helps brands find creators who can distribute, produce, or sell, and it helps creators present a credible reason for a brand partnership. This guide covers qualification, channels, pitch templates, follow-up, terms, product seeding, compliance, and measurement from both sides of the inbox.
Influencer outreach is the structured process of identifying, contacting, qualifying, and onboarding potential creator partners. Brands use it to recruit influencers, affiliates, UGC creators, and brand ambassadors. Content creators use the same process in reverse to approach brands, propose campaign ideas, and secure gifted collaborations, paid sponsorships, affiliate offers, or longer-term partnerships.
The outreach message is only one stage. A complete workflow also includes research, partner selection, offer design, negotiation, campaign activation, creator coordination, and performance review.
That broader view matters as creator marketing becomes a larger budget category. CreatorIQ’s State of Creator Marketing Report 2025-2026, based on 1,723 brands, agencies, and creators, reports that 71% of organizations increased creator-marketing investment year over year. More investment raises the cost of poor targeting, vague agreements, and unmeasured outreach.
The Five-Point Mutual-Fit Test is a pre-send framework for evaluating whether an outreach opportunity deserves attention. Brands can apply it to creator candidates, and creators can apply it to brands. A strong match passes all five points before either side spends time drafting a personalized pitch.
Follower count is not a sixth point. A nano influencer with a concentrated audience and a credible product use case may be more useful than a larger account with weak category relevance. The same principle applies to creators: a smaller DTC brand with a strong product match and clear creative opportunity may offer more portfolio value than a familiar company with no defined brief.
Brands that need a consistent vocabulary for smaller creator tiers can review this guide to what a micro influencer is. The practical lesson is to qualify the partnership around the job to be done, not around audience size alone.
A qualified shortlist should be built around the campaign role. Searching for “influencers” as one undifferentiated group mixes people with different strengths, economics, and measurement needs.
Use the Three-Role Creator Map:
One person may fill all three roles, but brands should not assume it. Define the primary role first, then vet recent content, audience conversation, prior partnerships, posting consistency, product-category conflicts, and obvious signs of inflated engagement. This guide to finding influencers for product promotion provides additional discovery methods for sellers.
Creators should build a brand shortlist with the same discipline. Start with products already used, categories that fit the audience, and companies whose current content leaves room for a distinct creator concept. A clear niche makes this easier, so creators still refining their positioning can use this niche-selection framework for influencers.

Use the channel that gives the recipient enough context to make a decision. Email is usually strongest for detailed proposals, rates, usage rights, attachments, and negotiation. A direct message works well as a warm introduction, a short follow-up, or an initial contact when no business email is available.
Platform-native marketplaces add structure. Meta’s Instagram Creator Marketplace announcement explains that brands can send projects with opportunity details and rates, while creators receive them in a dedicated Partnership Messages folder. Brands can also search by creator and audience attributes, and creators can build portfolios to improve discovery.
Shopify sellers can use Shopify Collabs recruiting tools to search, filter, and directly invite creators. Shopify currently limits merchants to 100 creator invitations in any seven-day period, which makes shortlist quality more important than indiscriminate volume.
As of July 2026, Shopify’s current Collabs overview states that the service is not accepting new creator signups, although merchants can still send direct invitations and accept creator applications. Existing creators can continue using the platform.
Brands comparing manual outreach with platform workflows can also review Stack Influence’s Instagram Creator Marketplace guide.
Write an influencer outreach message by making the partnership easy to evaluate. Identify the specific fit, state what you are proposing, explain the value exchange, summarize the requested work, and end with one simple next step. Personalization should prove relevance, not merely insert a name or compliment into a reusable template.
A useful first message has five parts:
Subject: [Brand] collaboration idea for your [specific content theme]
Hi [Name], I liked your recent [specific post] because [brief, genuine reason]. We are planning a campaign for [product and audience], and your [content format or perspective] looks relevant to the way customers use it.
The initial opportunity includes [gift, fee, commission, or hybrid], with a proposed [deliverable] by [timing]. We would also like to discuss [organic reposting, paid usage, or no additional usage].
Are you open to reviewing the full brief and terms?
Brands can adapt this structure using Stack Influence’s deeper outreach email guide for micro-influencers.
Subject: Content idea for [Brand or Product]
Hi [Name], I create [niche and format] for an audience interested in [relevant need]. I have been using or following [specific product, launch, or campaign], and I have an idea for [one-sentence concept] that would show [customer benefit or use case].
My relevant proof includes [audience insight, past result, portfolio example, or content skill]. I am interested in discussing a [gifted, paid, affiliate, UGC, or ambassador] partnership.
Is [concept] relevant to your current creator plans?
Creators should link a concise portfolio or media kit rather than attaching a large collection of unrelated files. These creator outreach email templates provide variations for first contact and follow-up.
Follow-up should reduce uncertainty, not add pressure. A practical sequence is one brief follow-up three to five business days after the first message, followed by a final note roughly one week later. Stop after that unless the recipient engages or a genuinely relevant new opportunity appears.
Do not resend the entire pitch. Restate the fit in one sentence, add any useful missing detail, and provide an easy way to decline. Brands should record response status and reasons, while creators should track contact names, dates, product categories, and previous outcomes.
A nonresponse is not proof that the idea was rejected. The message may have reached the wrong inbox, arrived during a launch, or required more work to evaluate than the recipient could justify.
An accepted pitch is not a complete agreement. Before shipping a product, creating content, or publishing a post, both sides should confirm the operational and commercial terms in writing.
Cover these items:
The Federal Trade Commission’s Disclosures 101 guidance says a material connection includes payment and free or discounted products, and creators should disclose that relationship clearly when endorsing a product. The FTC also states that creators are responsible for understanding and making the disclosure rather than relying entirely on another party.
TikTok’s commercial-content guidance requires creators promoting a third-party brand for payment or another incentive to turn on the content disclosure setting. The setting can label the post as a paid partnership, share post insights with a tagged brand partner, and simplify authorization for Spark Ads.
Most outreach advice overweights wording. When a campaign underperforms, the larger causes are often a mismatched list, an unattractive offer, hidden usage requests, slow product fulfillment, unclear briefs, or no system for following accepted creators through completion.
That distinction matters for ecommerce sellers. A positive reply has little value if the creator never receives the right product, cannot understand the deliverable, or disappears between acceptance and publication. Outreach quality should therefore be judged by completed, usable work, not by replies alone.
Stack Influence is built around that execution layer. The platform connects ecommerce brands with roughly 600,000 vetted creators through gifted-first product seeding, creator coordination, UGC generation, and completed-post accountability. A managed influencer product-seeding workflow is especially practical when a brand wants to activate many micro influencers without manually handling every message and follow-up.
During a three-month Stack Influence campaign for Targus, the campaign included 120 creator promotions. Average monthly unit sales increased from 56 to 221 during the measured period, while Amazon Best Seller Rank moved from #151,547 to #47,811. The case study does not isolate outreach as the sole cause, but it shows the value of connecting creator activation with fulfillment, completion, and marketplace measurement.
Results vary by product, category, pricing, marketplace conditions, creative quality, creator participation, and campaign execution.
The Outreach-to-Outcome Funnel separates communication efficiency from campaign value. It prevents a high reply rate from masking weak creator fit, poor completion, or unprofitable traffic.
Track seven stages:
Calculate reply rate from delivered messages, not the original list. Then compare qualified-positive rate, acceptance rate, activation rate, completion rate, cost per completed creator, usable assets per completion, and outcome metrics tied to the campaign objective.
For Shopify influencer marketing, use creator-specific links, codes, landing pages, and store analytics, while recognizing that codes can be shared and shoppers may convert through another device. This influencer-marketing tracking guide explains how to separate delivery, content, traffic, conversion, and long-term value.
Amazon sellers can use Amazon Attribution, a free measurement solution for eligible sellers and vendors, to examine how non-Amazon channels such as social, video, email, and influencer campaigns contribute to Amazon discovery and purchases. Amazon recommends separate tags when advertisers want reporting by tactic, creative, or audience group.
Eligible US Seller Brand Owners enrolled under Amazon’s Brand Referral Bonus guidance can earn a bonus averaging 10% of product sales driven by non-Amazon marketing efforts measured with Amazon Attribution. Treat that bonus as one economic input, not as proof that every creator touchpoint received full credit.
Attribution still has limits. A shopper may view a creator post, search the brand later, click an ad, and purchase through a different path. Report attributed revenue, directional lift, content value, and repeat customer behavior separately, and do not claim that correlation proves causation.
The best outreach program gets more efficient over time. After each campaign, classify creators by reliability, content quality, audience response, traffic quality, conversion contribution, communication, and reuse potential.
Strong performers may progress from product seeding to paid UGC, affiliate relationships, brand ambassador programs, recurring launches, or paid amplification. The next offer should reflect the value already demonstrated, not simply repeat the original terms.
Brands should also document content rights before repurposing creator work across ads, product pages, email, or an Amazon listing. This guide to UGC versus brand-generated content explains why authentic creator assets and brand-owned creative play different roles.
Creators benefit from the same review. Track which brand deals strengthened the portfolio, paid fairly, respected the brief, communicated clearly, and produced useful performance evidence. That record turns future outreach from a cold request into a proof-backed proposal.
Influencer outreach works when relevance, value, execution, and measurement reinforce one another. Brands need a qualified shortlist and an offer creators can evaluate quickly. Content creators need a focused brand list, a concrete concept, and proof that they understand the customer and campaign objective.
Start with the Five-Point Mutual-Fit Test, send a concise pitch, document the terms, and follow every accepted partner through completion and outcomes. Ecommerce teams that want to reduce manual coordination can evaluate a managed product-seeding workflow that connects creator activation, UGC production, and completed-post accountability in one campaign system.