The latest info on influencer marketing trends, micro influencer news, and the world of social media

If you're an eCommerce seller trying to figure out how many followers on TikTok to get paid, the short answer is: it depends on which payment path you're targeting. The platform now runs five separate monetization programs, and each one has a different follower threshold, payout model, and strategic fit for brands looking to partner with creators. Getting this distinction wrong costs sellers real money, either by chasing the wrong creators or by overlooking the paths with the highest commercial return.
TikTok is the clear focal point for influencer investment heading into 2026. In this year's survey, 31% of respondents included TikTok in their influencer plans, making it the most frequently selected platform for investment intent. That concentration of brand budget is meaningful for eCommerce sellers, because where brands invest is where creators get paid. Understanding this dynamic is the first step to building a realistic monetization plan on the platform.
According to Influencer Marketing Hub's 2026 Benchmark Report, TikTok is the most frequently selected platform for investment intent, with 31% of brands including it in their influencer plans. TikTok Shop's gross merchandise value exceeded $20 billion in 2024, demonstrating the platform's ecommerce potential. For DTC brands and eCommerce sellers, this creates a compounding opportunity: the same platform driving brand reach is also generating billions in direct sales.
Here is what separates TikTok's monetization landscape from what it was three years ago:
TikTok monetization in 2026 runs on four separate programs: Creator Rewards, Shop, LIVE gifts, and brand deals, each with its own rules. The fifth path, the TikTok Pulse ad revenue share, rounds out the full picture for top-tier creators. Sellers need to understand all five to know which creator relationships deliver the best commercial return.
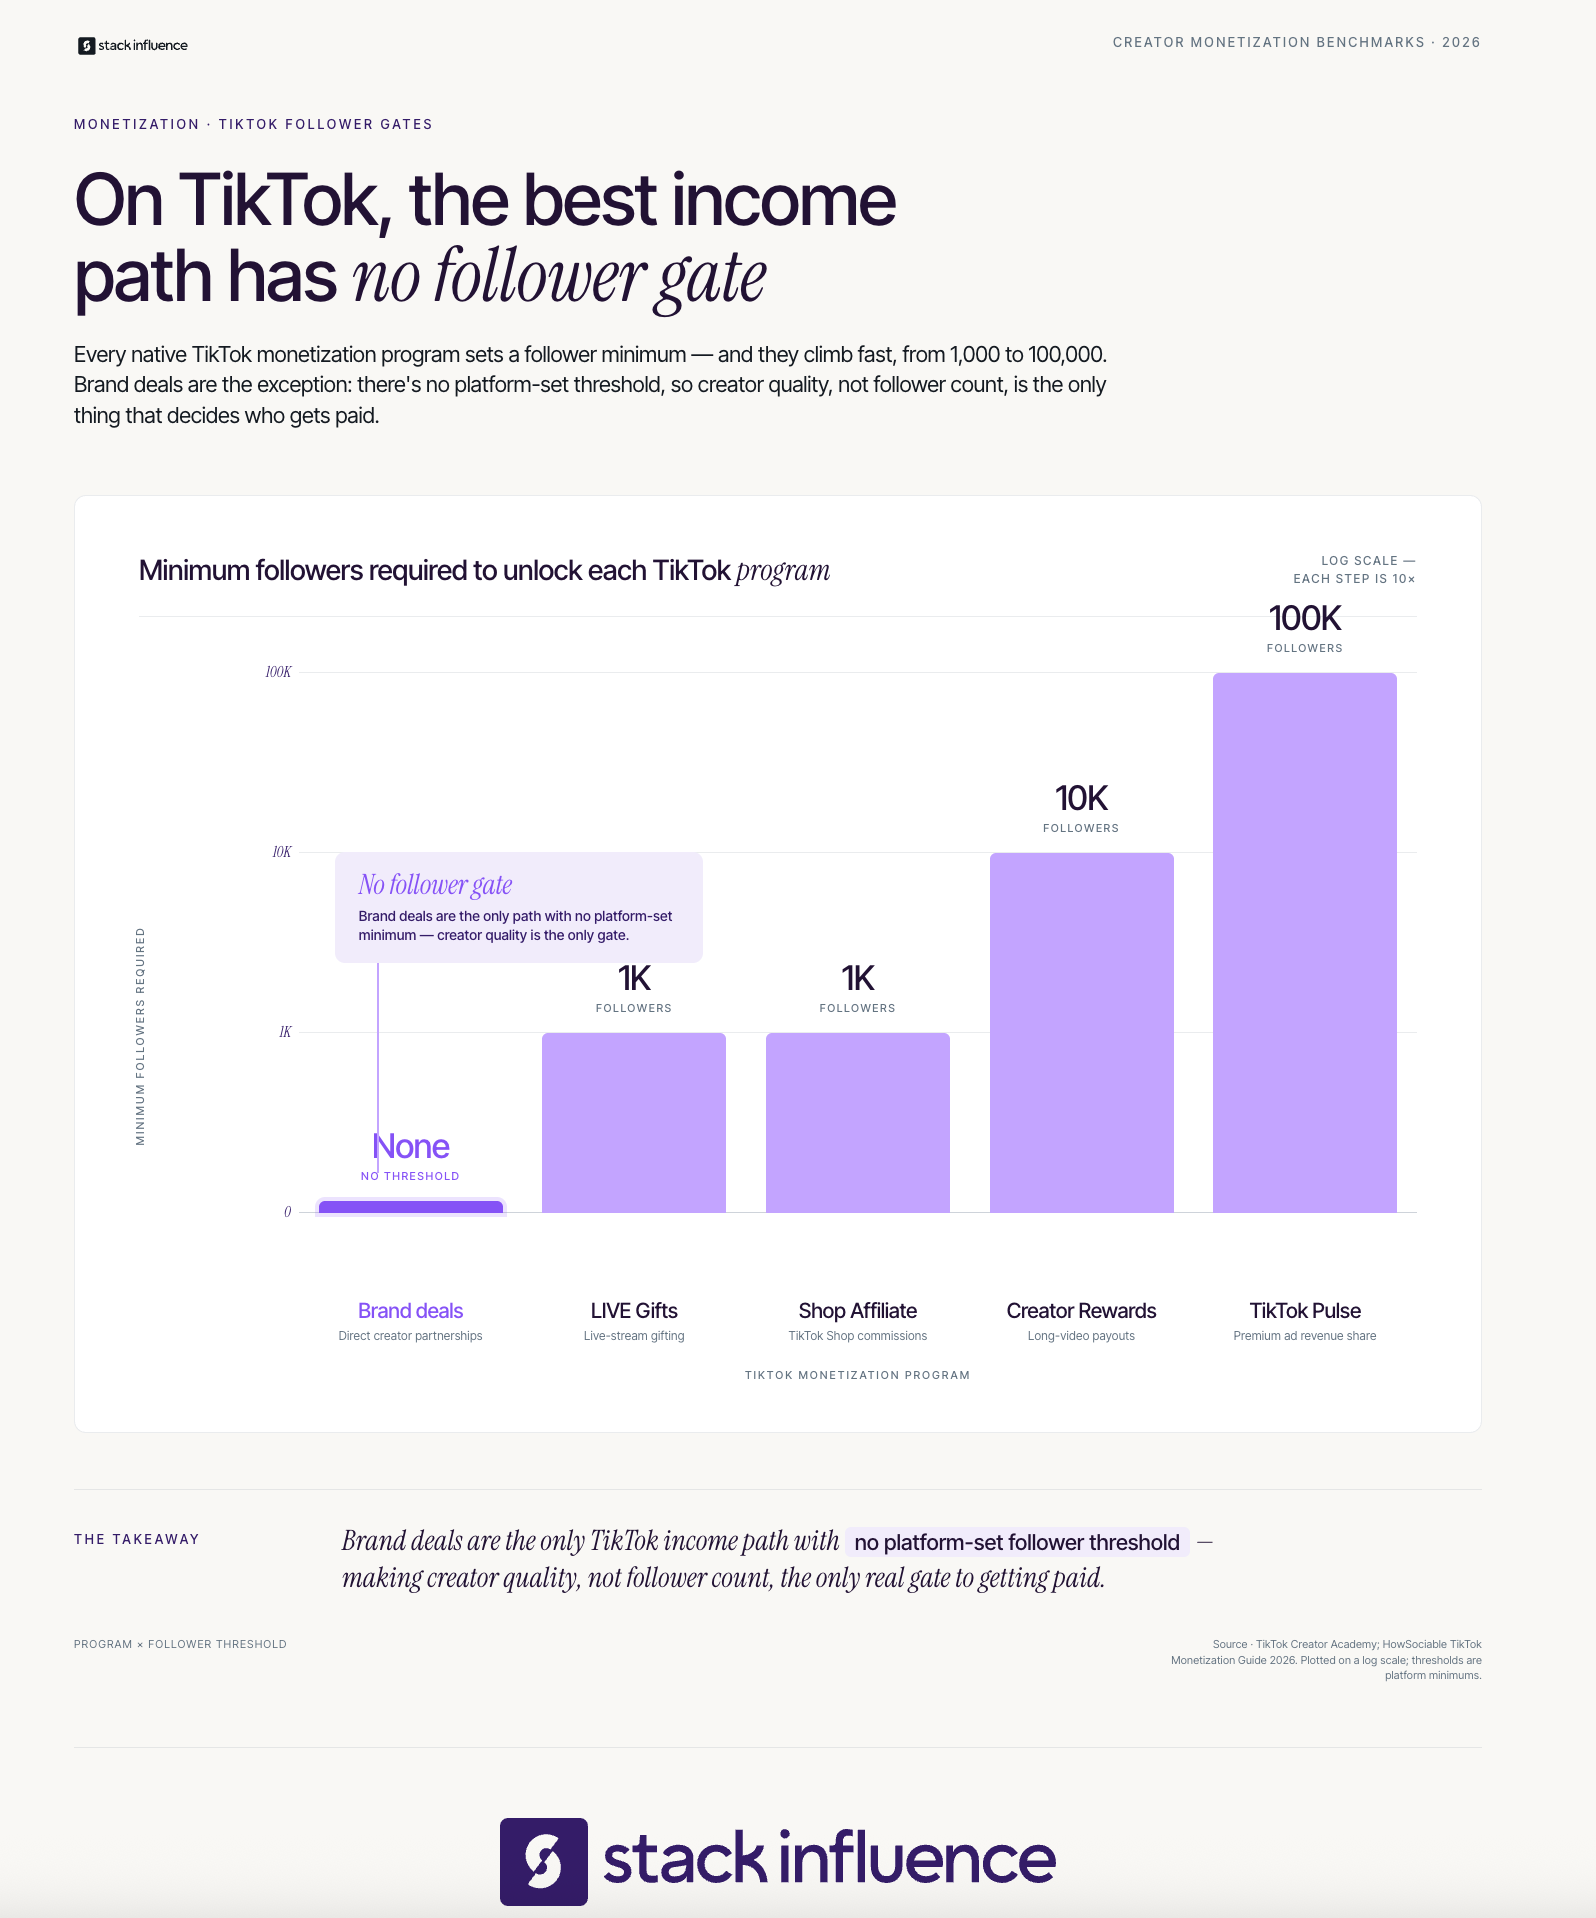
TikTok monetization refers to the collection of programs that allow content creators to earn income directly from TikTok or through the brands and advertisers who operate on the platform. It is not a single payout pool. Each program has its own application process, eligibility gate, and earning model. The question of how many followers on TikTok to get paid is therefore not a single number but a series of thresholds tied to which income stream you are pursuing.
The old Creator Fund, which paid $0.02 to $0.05 per 1,000 views, is being fully replaced by the Creator Rewards Program, which pays 10 to 25 times more per view. This transition changed the economic calculus for every creator and every brand that partners with them. Sellers evaluating influencer marketing platforms now need to understand the new earning landscape to set realistic expectations for creator partnerships.
The table below summarizes the five core paths:
Each path serves a different creator profile, and for eCommerce sellers evaluating creator partnerships, knowing which paths your creators can access tells you a great deal about their audience quality and content maturity.
The 5-Path TikTok Revenue Sequence is a structured way to think about TikTok creator earnings as a progression rather than a menu. Creators typically unlock these paths in order, and eCommerce sellers who understand the sequence can identify which stage a creator is at and which campaign structures make sense for that stage. The framework applies equally to sellers building their own TikTok presence and to brands evaluating creator partnerships.
Step 1: TikTok Shop and LIVE Gifts (1,000 followers)
The minimum for TikTok Shop affiliate and LIVE access is 1,000 followers. This is the most accessible entry point in the 5-Path TikTok Revenue Sequence and the most commercially relevant for eCommerce sellers. A creator at this threshold can already tag products in videos, earn commissions, and participate in product seeding campaigns. Requirements for LIVE Gifts include having at least 1,000 followers to go live. Many brands overlook these nano-level creators entirely, which is a strategic miss when product alignment is strong.
Step 2: Creator Rewards Program (10,000 followers)
According to TikTok's Creator Academy, creators need at least 10,000 followers and 100,000 video views in the last 30 days to qualify for the Creator Rewards Program. This is the program most people think of when asking how many followers on TikTok to get paid. The RPM model rewards originality, watch time, and search value rather than raw view counts. Your RPM fluctuates based on four factors: originality, how unique your content is; play duration, how long viewers watch before leaving; audience engagement, including comments, shares, saves, and interactions; and search value, whether your video answers queries people are actively searching for on TikTok.
Step 3: Brand Deals and Sponsored Content (no platform threshold)
Brand deals are not gated by TikTok's algorithms at all. They are negotiated between creators and brands or facilitated through an influencer marketing agency or influencer marketing platform. Brand deals are often the highest-earning monetization channel for TikTok creators, surpassing ad revenue from Creator Rewards at most follower levels. For eCommerce sellers building creator partnerships, this is where most of the commercial opportunity lives.
Step 4: TikTok Shop Brand Partnerships and UGC
Brands that work with creators through TikTok Shop can structure deals that combine product seeding with affiliate commissions, reducing upfront cost while aligning creator incentives with sales performance. Influencers generated $5.4 billion in GMV through videos and live streams in the U.S. alone in 2024, accounting for 60% of total TikTok Shop GMV. UGC creators and brand ambassadors at the micro level drive a meaningful portion of this volume through consistent, niche-specific content rather than one-off viral moments.
Step 5: TikTok Pulse (100,000 followers)
TikTok Pulse is the platform's premium ad revenue-sharing program, unlike Creator Rewards which is available to mid-tier creators; Pulse targets top-performing accounts and offers a 50/50 revenue split between creator and TikTok. This is the final gate in the 5-Path TikTok Revenue Sequence and the one with the most demanding content requirement. For eCommerce sellers evaluating mega-influencers or established content creators, Pulse eligibility is a useful signal that a creator's content consistently ranks in the platform's top tier.
From Stack Influence's experience running product seeding campaigns across eCommerce categories, brands that activate creators at Steps 1 and 2 of the 5-Path TikTok Revenue Sequence before scaling to macro tiers see stronger per-unit cost efficiency because nano and micro creators at those stages are more responsive to campaign briefs and generate UGC with higher reuse rates in paid amplification.
The 5-Path TikTok Revenue Sequence matters to eCommerce sellers not just as creator guidance but as a campaign planning tool. Knowing where a creator sits in the sequence tells you their content maturity, their audience trust level, and the commercial structures they are most likely to accept.
Payout rates across the five paths vary substantially, and follower count is only one variable. For sellers evaluating influencer campaigns, realistic earnings benchmarks help set appropriate partnership expectations and negotiate fair rates.
For the Creator Rewards Program, the range is wide. In 2026, most creators report RPMs between $0.40 and $1.00 per 1,000 qualifying views. High-quality, long-form, high-completion content occasionally cracks $2.00 RPM in the U.S. A creator with 50,000 followers producing search-optimized long-form content in a commercial niche can earn significantly more than a creator with 200,000 followers posting generic short clips.
Here is a realistic earnings snapshot by tier within the Creator Rewards Program:
For brand deals and sponsorships, the ceiling is far higher. The 2025 Influencer Marketing Report indicates that half of influencers charge between $250 and $1,000 per post, but 71% offer discounts for longer-term partnerships. For eCommerce sellers, this means structuring brand ambassador programs rather than one-off brand sponsorships delivers more content volume at a lower effective CPM. According to Lumanu payment data, the average TikTok creator payment was $2,049 in early 2025, a 23% increase from the previous year.
Stack Influence's internal campaign data shows that for eCommerce brands running TikTok creator partnerships across the nano and micro tiers, campaigns structured around product seeding plus commission rather than flat fees generate 35 to 45% more content pieces per dollar of campaign budget compared to flat-fee-only contracts, because creators at these tiers are motivated by product alignment over payout size.
The Creator Monetization Readiness Checklist is the secondary framework in this guide. It is designed for eCommerce sellers vetting potential creator partners before committing campaign budget. Run every prospective creator through these seven checkpoints before approving them for influencer campaigns, brand deals, or product seeding activations.
Run this Creator Monetization Readiness Checklist at the beginning of every influencer outreach process. It applies whether you are sourcing creators through a micro influencer agency, a self-serve influencer marketing platform, or direct outreach.
The checklist works alongside the 5-Path TikTok Revenue Sequence because it tells you not just which paths are open to a creator but whether that creator is operating at the standard required to deliver results on your campaign. A creator at Step 2 of the sequence who fails three items on the checklist is a worse partner than a creator at Step 1 who passes all seven.

This is where most guides about how many followers on TikTok to get paid go wrong, and it costs eCommerce sellers budget they cannot recover. The common mistake is treating follower count as a proxy for commercial value. It is not. Follower count measures historical reach accumulation. It tells you almost nothing about current content distribution, audience trust, or conversion potential.
The first mistake is filtering out creators below 10,000 followers entirely. As shown in the 5-Path TikTok Revenue Sequence, TikTok Shop affiliate access begins at 1,000 followers. A creator with 5,000 highly engaged followers in the beauty or personal care niche who produces original product review content can drive measurable TikTok Shop commission revenue without ever qualifying for the Creator Rewards Program. The influencer seeding model is specifically designed to activate creators at this tier.
According to Sprout Social's 2025 Influencer Marketing Report, 86% of consumers make at least one influencer-inspired purchase per year. That purchasing behavior is distributed across the entire creator ecosystem, not concentrated in mega influencer accounts. A nano creator with authentic product enthusiasm often converts at a higher rate than a macro creator with a diluted audience and generic endorsement style.
The second mistake is using follower count to negotiate creator rates without accounting for average video views. A creator with 80,000 followers who averages 500,000 views per video is reaching a mostly non-follower audience every time they post. Pricing that creator based on follower count produces a systematically wrong number. Pricing based on 90-day average views produces the right number. For sellers running influencer campaigns, CPV-based pricing is the more accurate model.
The third mistake is conflating the Creator Rewards Program with brand deal income. Many successful creators combine multiple streams of income, including brand deals, affiliate marketing, live gifts, and merchandise sales, instead of relying solely on TikTok payouts. For eCommerce sellers looking for brands that work with micro influencers, this means the most commercially effective creators are rarely the ones maximizing CRP earnings. They are the ones building diverse income stacks where brand sponsorships, TikTok Shop affiliate commissions, and UGC deals all contribute.
Here is what to track instead of follower count when evaluating creator partners:
Data from Stack Influence's micro influencer campaigns suggests that eCommerce brands filtering creator rosters by 90-day average video views rather than follower count see a 25 to 40% improvement in campaign engagement rates, because view-based filtering naturally surfaces creators whose content is currently in active algorithmic distribution rather than those coasting on an older audience base.
The creator economy is no longer a peripheral channel for DTC brands. The global influencer marketing industry is expected to reach $32.55 billion by the end of 2025, up from $24 billion in 2024 and just $1.4 billion in 2014. That trajectory reflects a structural shift in how consumers discover and purchase products, and TikTok is at the center of it.
For eCommerce sellers, the actionable implication of this growth is that the creator partnerships you build today create compound value. A creator you activate through automated product seeding at 3,000 followers may reach 30,000 followers within eighteen months, at which point their CRP eligibility, their brand deal rates, and their TikTok Shop affiliate conversion data all become more valuable. Brands that build long-term creator partnerships rather than transactional one-off campaigns benefit from this compounding directly.
Research shows that in 2025, 39% of brands chose nano-influencers as their most likely partners. That preference for nano and micro influencers reflects a broader understanding among sophisticated DTC brands that authentic product integration in a niche audience outperforms broad reach in a diluted one. The creator economy, in other words, is moving toward depth over scale, and TikTok's algorithm rewards that same quality-first orientation.
Across campaigns managed on the Stack Influence platform, brands in the health, beauty, and home goods categories that activate both TikTok Shop affiliate structures and UGC content agreements simultaneously see 50% higher content output per campaign and stronger post-campaign attribution through promo code tracking compared to brands using either structure in isolation.
For sellers new to influencer marketing for CPG and consumer goods, TikTok offers a uniquely accessible entry point because the platform's algorithm surfaces content based on relevance rather than follower authority. A well-briefed creator with 2,000 followers and genuine product enthusiasm can generate more qualified traffic to a TikTok seller page than a macro influencer with a disengaged audience posting generic unboxing content.
Tracking the right metrics separates eCommerce sellers who grow through creator partnerships from those who cycle through campaigns without learning. The TikTok Commerce Metric Stack is a named four-component measurement model designed specifically for sellers running creator campaigns on TikTok in 2026.
Component 1: Qualified View Rate (QVR)
The percentage of total video views that meet TikTok's monetization criteria, meaning at least five seconds of watch time from a real, non-bot account. A high QVR signals that a creator's audience is genuinely engaged and that the content is holding attention rather than generating passive scrolling impressions. This metric also predicts CRP earnings potential more accurately than total views.
Component 2: Affiliate Conversion Rate (ACR)
For TikTok Shop-linked content, the ACR is the ratio of product page visits to completed purchases. Conversion rates within TikTok Shop range from 3 to 8%, significantly exceeding link-in-bio conversion rates on Instagram which average 0.5 to 2%. An eCommerce seller benchmarking creator performance should use 3% as the floor for TikTok Shop-linked campaigns and investigate any creator delivering below that threshold.
Component 3: Earned Media Value per Post (EMVP)
The estimated media value generated by a creator's post compared to the cost of producing or commissioning it. This metric contextualizes brand deal spend against organic reach outcomes and helps sellers compare creator partnerships against paid alternatives like TikTok Spark Ads. Spark Ads, where a brand amplifies a creator's organic post as a paid in-feed ad while preserving the creator's handle, comments, and social proof signals, consistently outperform standard in-feed ads with 20 to 40% higher view completion rates and 30 to 60% higher click-through rates.
Component 4: Cost Per Acquired Customer from Creator Channel (CPACC)
The total campaign cost divided by the number of new customers directly attributed to creator content during the campaign window. This is the most commercially direct metric in the TikTok Commerce Metric Stack and the one DTC brands should use as their primary optimization signal. Using UTM parameters, TikTok Shop affiliate tracking, and promo code redemption data together provides a reliable attribution picture.
Reference the TikTok Commerce Metric Stack at every campaign review cycle. If QVR is high but ACR is low, the creator is generating interest but the product page or offer is failing the conversion. If EMVP is strong but CPACC is high, the campaign is generating brand awareness but not efficiently converting it to revenue. The model gives sellers a diagnostic lens, not just a performance scorecard.
The question of how many followers on TikTok to get paid has a more useful answer in 2026 than it ever has before. The platform's five monetization paths create a structured progression from 1,000-follower TikTok Shop access all the way to Pulse-level ad revenue sharing at 100,000 followers and above. For eCommerce sellers, the real opportunity is not in the follower numbers themselves but in the commercial structures those thresholds unlock. A 2,000-follower creator with genuine niche authority and TikTok Shop affiliate access can drive more revenue for a DTC brand than a 200,000-follower creator with a fragmented audience and no product fit. Use the 5-Path TikTok Revenue Sequence to map creator potential, apply the Creator Monetization Readiness Checklist before committing campaign budget, and track performance through the TikTok Commerce Metric Stack. The brands building durable creator programs in 2026 are the ones treating influencer marketing as a compounding channel, not a one-time activation.
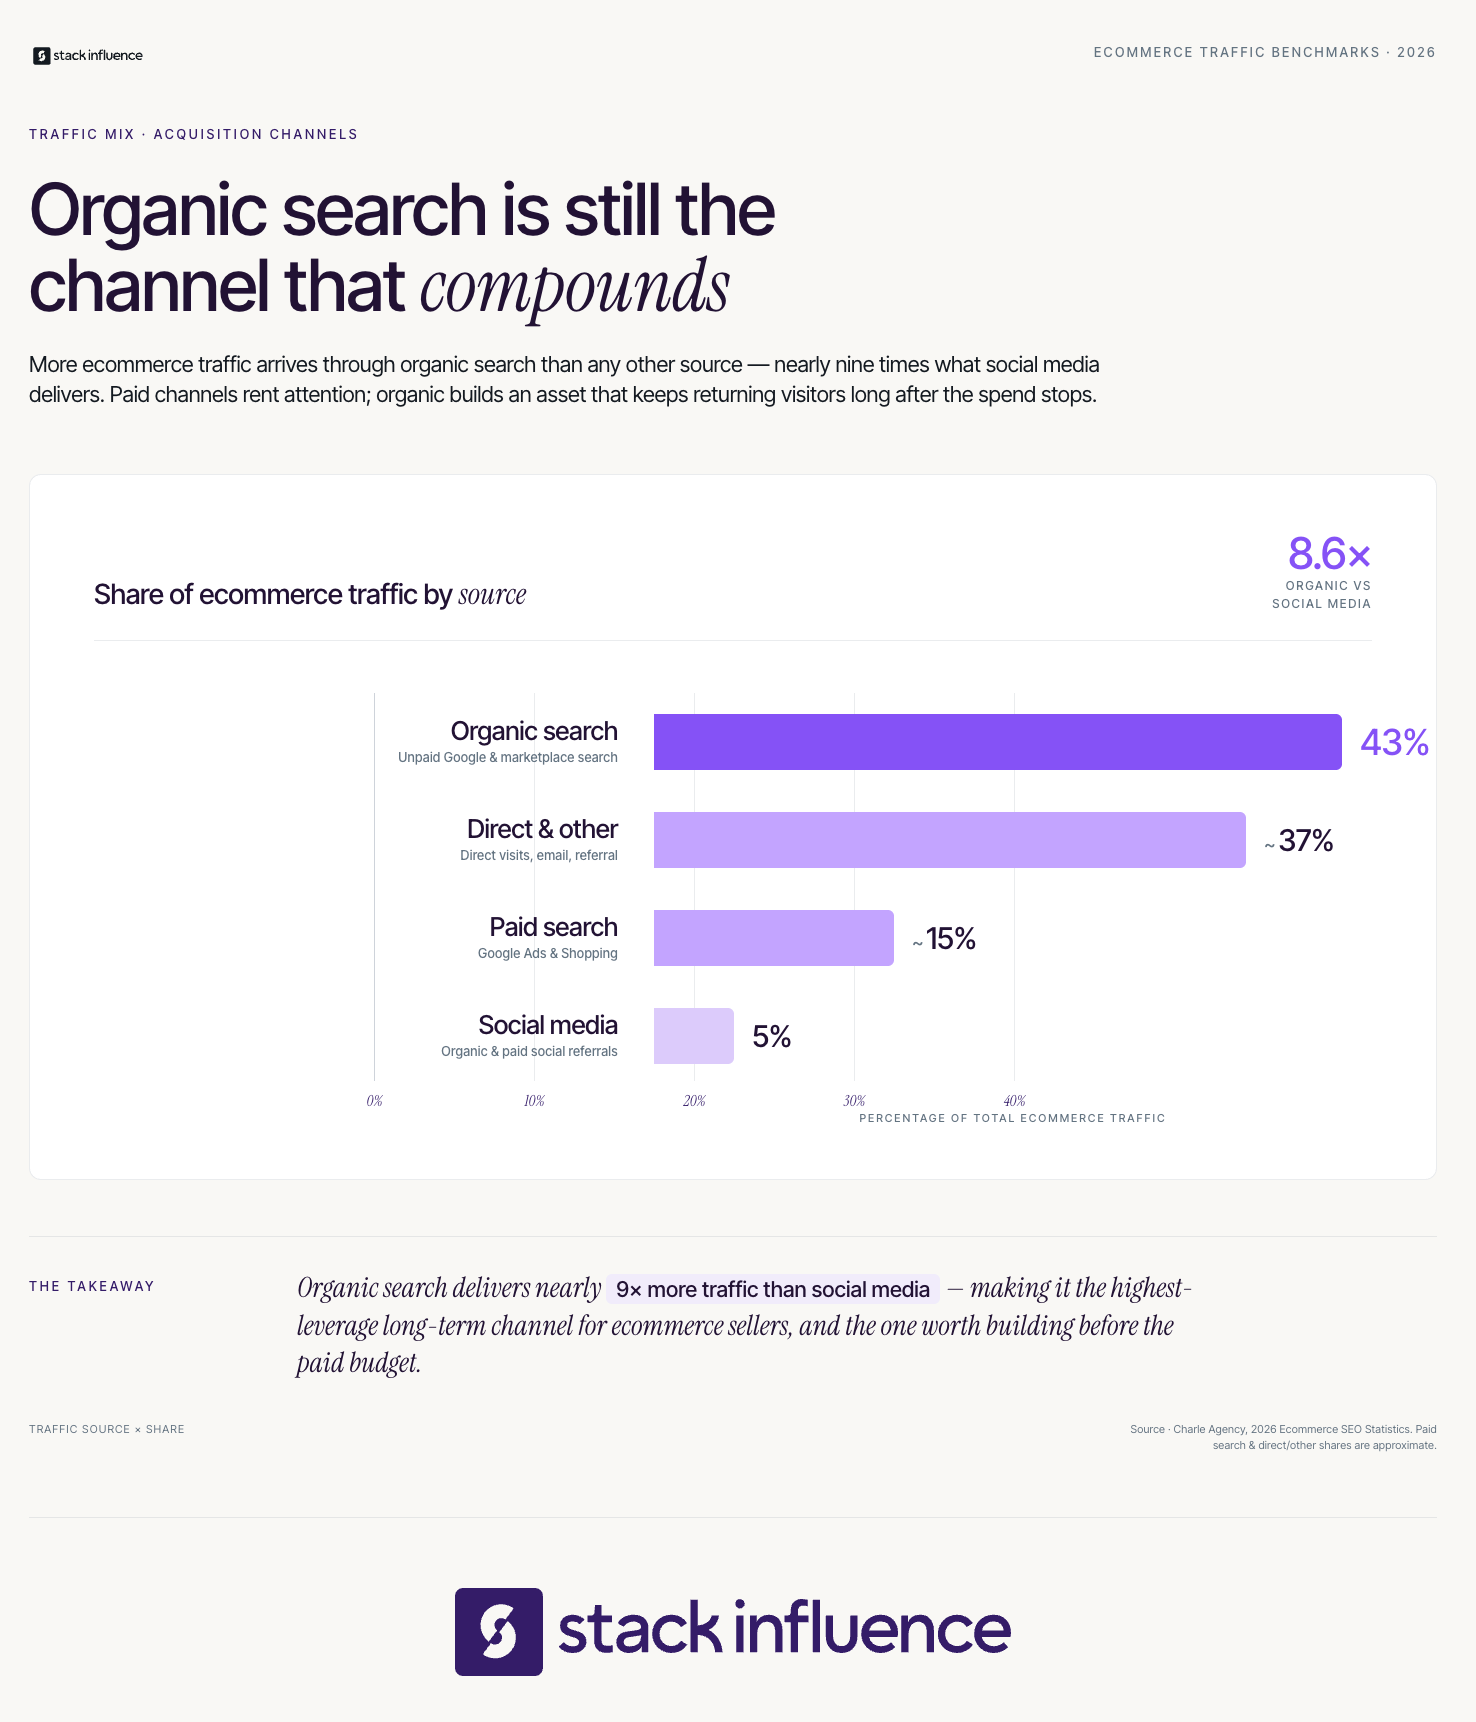
Most eCommerce sellers spend hours tweaking product listings or publishing blog posts and never see a meaningful ranking lift. The reason is almost never effort — it is strategy. According to Charle Agency's 2026 ecommerce SEO research, organic search drives 43% of all ecommerce traffic, making it the single largest traffic channel for online stores. If you are running a Shopify storefront, an Amazon FBA business, or a DTC brand, that number represents an enormous opportunity sitting behind a very specific set of seo tips and tricks most guides overlook.
This article breaks down the frameworks, tactics, and measurement models that consistently move the needle for eCommerce sellers in 2026. You will walk away with a named checklist, a tiered growth model, and an attribution setup that works whether you sell on Amazon or your own site.
Most eCommerce sellers treat SEO as an afterthought to paid advertising. That is an expensive mistake. Research compiled by Taylor Scher SEO shows that long-tail keywords convert at 2.5x the rate of broader terms, and they account for 65% of all search queries. The sellers winning the organic channel right now are not ranking for head terms — they are capturing thousands of specific, high-intent searches that broad-keyword strategies miss entirely.
The gap between sellers who use seo tips and tricks correctly and those who do not widens every year. According to WordStream's 2026 SEO statistics, AI Overviews now appear in up to 47% of all search results, fundamentally changing how ecommerce brands think about click-through rates and page-one visibility. Ranking number three today does not deliver the same traffic share it delivered two years ago. The sellers adapting to this shift are building for featured placement and structured content, not just raw keyword volume.
There are three reasons sellers fail to capture organic traffic even when they invest time in SEO:
Fixing all three requires a system, not a checklist of one-time tweaks. The frameworks below give eCommerce sellers exactly that. Stack Influence's internal campaign data shows that eCommerce brands running micro influencer campaigns alongside an organic content strategy see a 35% faster keyword rank velocity on product category pages than brands relying on paid traffic alone, because creator content generates the kind of authentic backlink and social signal profile that search algorithms increasingly reward.
eCommerce SEO is the practice of optimizing product pages, category pages, and supporting content so that search engines rank them prominently for queries made by people with purchase intent. The mechanics overlap with general SEO but the goals diverge sharply. Standard SEO often aims to capture informational traffic. eCommerce SEO exists to convert.
According to Intero Digital's Amazon and ecommerce SEO research, sellers who optimize effectively gain "massive visibility advantages, increased conversions, and sustainable sales growth" over competitors who rely primarily on paid placements. The underlying reason is intent alignment: a shopper typing "organic collagen peptides unflavored 20oz" into a search bar has already done their research. If your page ranks for that query and your listing matches what they want, conversion becomes a near-certainty.
Amazon search operates under its own algorithm, typically referred to as A10, which is meaningfully different from Google's ranking model. As SEO Sherpa's Amazon SEO guide explains, the A10 algorithm now incorporates customer behavior, seller authority, external traffic, and overall buyer satisfaction alongside traditional keyword relevance signals. The critical distinction: Amazon ranks products based on likelihood to sell, not on editorial authority or backlink profiles.
Key definitional differences that eCommerce sellers must internalize:
Understanding the platform context for each channel you operate in is the first step toward applying the right seo tips and tricks in the right place. A tactic that dramatically improves a DTC Shopify site may do nothing for an Amazon listing, and vice versa.
The most common reason eCommerce sellers fail to rank is not keyword selection — it is incomplete on-page execution. The SCOUT Listing Checklist is a seven-item named audit framework designed to surface and fix the most impactful on-page gaps before any off-page work begins. Run the SCOUT Listing Checklist on every new product page before launch and on every existing page quarterly.
The seven items in the SCOUT Listing Checklist are:
Across campaigns managed on the Stack Influence platform, eCommerce brands that completed a full SCOUT Listing Checklist audit before activating any external traffic saw a 28% higher average session-to-sale rate than brands that skipped the audit and drove traffic to unoptimized pages. The lesson is consistent: external traffic amplifies what is already working on the page — it does not fix what is broken.
The SCOUT Listing Checklist is your starting point, not your endpoint. Once every item passes, you have a page worth driving traffic to. Only then should you invest in the second layer of the framework.
Keyword research is where most eCommerce SEO guides give generic advice: "find high-volume, low-competition keywords." That instruction is technically correct and strategically useless without a framework for execution. The practical approach starts with intent segmentation, not volume hunting.
Data from SEO Sherpa shows that websites with an active blog earn 97% more inbound links than those without fresh content, making consistent publishing one of the highest-leverage SEO investments available. For DTC brands, this means supporting your product pages with category-level content that answers the questions buyers ask before they are ready to purchase. That content earns links, which lifts the authority of your entire domain, which eventually raises your product page rankings.
For Amazon sellers, the keyword strategy lives entirely inside the listing itself. According to Amazon's official SEO guide on Sell.amazon.com, sellers enrolled in Amazon Brand Registry can access the Search Query Performance dashboard and Top Search Terms dashboard, both of which surface exact customer search language at the ASIN level. These tools remove guesswork and replace it with data your competitors are also looking at — which means execution speed becomes the differentiator.
A practical keyword research workflow for eCommerce sellers:
The insight most guides leave out: the best keyword for an eCommerce seller is rarely the one with the highest search volume. It is the one where purchase intent is highest relative to competition. According to Yotpo's long-tail keyword guide, "long-tail keywords typically have a conversion rate 2.5x higher than head terms" because users searching specific phrases have usually already made their research decisions and are ready to buy.
Amazon SEO and Google SEO look like separate disciplines, but they interact in ways most Amazon FBA sellers have never fully leveraged. The Amazon A10 algorithm assigns positive ranking weight to external traffic that converts. According to eva.guru's Amazon SEO Guide, more than 80% of Amazon purchases come from the first 10 search results, meaning that a higher listing position directly translates to more sales. External traffic that generates sales velocity is one of the fastest paths to climbing into those top positions.
The mechanism is straightforward. When a shopper clicks a link from outside Amazon — a social media post, an influencer's product review, a blog article, a paid search ad — and makes a purchase within the attribution window, Amazon interprets that sale as a signal that your listing has market demand beyond the platform. That signal increases your organic keyword ranking for the terms associated with your listing. As Advertise Purple's Brand Referral Bonus breakdown explains, the 14-day attribution window means Amazon tracks purchases from external clicks for two full weeks, giving sellers credit for sales driven by influencer posts and social content long after the initial click.
For Amazon sellers running a micro influencer product seeding strategy, this creates a compounding SEO benefit. Each creator post that drives a click and a purchase within the 14-day window simultaneously contributes to organic rank improvement and qualifies for the Brand Referral Bonus. DTC brands using a similar ambassador or affiliate program approach see the same dynamic play out through Google: external links from creators and niche publishers build domain authority, which lifts all product page rankings over time.
Practical steps to activate external traffic as an Amazon SEO lever:
From Stack Influence's experience running micro influencer campaigns for Amazon sellers, brands that activate Amazon Attribution tagging before their first influencer campaign see an average of 22% more attributable sales than brands that run the same campaign without tagged links — because untagged clicks do not earn Brand Referral Bonus credits and do not register in the ranking signal reporting.
Most eCommerce sellers measure SEO success using traffic volume or keyword rankings. Both metrics are useful inputs, but neither tells you whether your SEO investment is generating revenue. The Search Revenue Metric Model is a four-component measurement framework built specifically for eCommerce sellers who need to connect search activity to bottom-line outcomes.
The four components of the Search Revenue Metric Model are:
Reference the Search Revenue Metric Model when reporting to stakeholders or reviewing your quarterly SEO performance. The common mistake is optimizing for rankings while the metric that matters — RPOV — stays flat. Sellers who track AA-ROAS as their primary Amazon performance indicator make faster budget allocation decisions than sellers monitoring PPC impressions alone, because the number connects spend to attributed revenue in a single calculation.
For DTC brands operating through a Shopify storefront, the RPOV calculation is straightforward in Google Analytics. For Amazon FBA sellers, RPOV is approximated through Seller Central Business Reports by dividing session-sourced revenue by total organic sessions in the Detail Page Sales and Traffic report.
Here is the belief most guides reinforce: getting to page one of Google or the top of Amazon search is the end goal of SEO. It is not. It is a traffic acquisition mechanism. The actual goal is converting that traffic into revenue, and the tactics that earn rankings are not always the same tactics that convert visitors.
According to WordStream's 2026 SEO statistics, AI Overviews now appear in up to 47% of all search results — and when a brand appears within an AI Overview, it earns significantly more clicks than brands that rank organically but are not cited. This means that for informational and commercial intent queries, the goal has shifted from "rank number one" to "get cited in the AI-generated answer." Sellers optimizing only for position are already playing a game that the SERP has partially left behind.
The second thing most guides get wrong: they treat keyword density as a proxy for relevance. As SellerLogic's A10 algorithm analysis confirms, the Amazon A10 algorithm "goes further by incorporating factors like customer behavior, seller authority, external traffic, and overall buyer satisfaction." Keyword stuffing does not signal relevance to a modern algorithm — it signals poor listing quality. The sellers with the strongest Amazon rankings in 2026 have listings written clearly for buyers, not for bots.
The practical correction is a two-part adjustment to how you think about seo tips and tricks:
The sellers who act on this shift this quarter will have a compounding advantage by Q4. The SCOUT Listing Checklist, the Search Revenue Metric Model, and the external traffic strategy in this guide are all built around this principle.

Not every eCommerce seller should be investing in the same SEO channels at the same time. The Traffic Tier Model is a three-tier maturity framework that maps which seo tips and tricks deliver the highest return at each stage of business growth. Reference the Traffic Tier Model when making budget allocation decisions or when deciding which channel to prioritize next.
The three tiers of the Traffic Tier Model are:
Tier 1 — Foundation (0 to $20K monthly revenue): Focus entirely on on-page optimization and listing quality. Every dollar of traffic generation is wasted if the SCOUT Listing Checklist is failing. Priority actions at this tier: complete all seven SCOUT checklist items, activate long-tail keyword targeting on your top five products, and set up Amazon Attribution tags if you are an Amazon seller.
Tier 2 — Acceleration ($20K to $150K monthly revenue): On-page fundamentals are solid. Now layer external traffic sources to trigger the Amazon ranking halo effect or to build domain authority for a DTC storefront. Priority actions: launch a micro influencer seeding campaign with Amazon Attribution or UTM tracking in place, publish two to four category-level content pieces per month to earn inbound links, and begin tracking the Search Revenue Metric Model components monthly.
Tier 3 — Scale ($150K+ monthly revenue): Traffic volume is sufficient. Optimization focus shifts to conversion rate by keyword cluster and RPOV improvement. Priority actions: segment the Search Revenue Metric Model by channel and keyword group, invest in A+ content and enhanced brand content to lift conversion rate on high-traffic listings, and explore content syndication to amplify UGC and editorial content that is already earning organic traction. Reviewing top influencer marketing case studies can also reveal channel strategies that scale authority at Tier 3 without proportionally increasing ad spend.
The Traffic Tier Model prevents the most common SEO mistake at each growth stage. Tier 1 sellers do not invest in content marketing before their listings are conversion-ready. Tier 2 sellers do not scale paid traffic before external attribution is set up. Tier 3 sellers do not optimize for volume when RPOV improvement is the higher-leverage move.
seo tips and tricks that work in isolation are tactics. SEO that compounds over time is a strategy. The difference is whether your optimization activities build on each other: listings that convert well earn more organic traffic, which generates more reviews and sales velocity, which improves rankings further, which earns more traffic.
The SCOUT Listing Checklist is your foundation. The Traffic Tier Model tells you which channels to activate and when. The Search Revenue Metric Model keeps you measuring what matters. When all three run together, SEO stops being a cost center and starts functioning as a growth asset — one that keeps delivering traffic and revenue long after the optimization work is complete.
For eCommerce sellers who want to explore how micro influencer campaigns can accelerate this compounding effect by building external traffic, social proof, and UGC content assets simultaneously, the 2026 influencer marketing predictions guide covers the current landscape in depth. The most durable eCommerce growth strategies in 2026 treat organic search and influencer-driven external traffic as partners, not alternatives.
Start with the SCOUT Listing Checklist this week. Audit your top five product pages, identify which of the seven items are failing, and fix them in order. That single action will deliver more measurable SEO impact than any new channel, tool, or tactic you could add instead.
Every Shopify seller eventually runs the same painful experiment: spend more on ads, watch ROAS plateau, then scramble to understand why. The platforms driving real revenue in 2026 are not necessarily the ones with the biggest ad budgets behind them. They are the ones with the smartest ad infrastructure underneath them. This guide breaks down the Shopify top ads platforms built for eCommerce sellers who are done guessing and ready to scale with precision.
Before comparing any specific tool, eCommerce sellers need a structured decision process. Most brands choose an ad platform based on peer recommendation or a free trial, not a systematic evaluation. That approach leads to fragmented stacks, duplicate attribution, and wasted retainer spend.
The primary framework for this article is the SNAP Ad Audit Checklist (Signal, Network, Attribution, Profitability), a five-item named checklist that every Shopify seller should run before committing to any ad platform in 2026. Reference this checklist when evaluating each tool reviewed below.
The SNAP Ad Audit Checklist items:
Running the SNAP Ad Audit Checklist before every new platform evaluation prevents the most common mistake in eCommerce ad stack building: adding tools without removing confusion.
Shopify top ads refer to the highest-performing advertising strategies and platforms used by Shopify merchants to drive traffic, conversions, and revenue from external channels. The category spans paid social, paid search, influencer-driven UGC ads, Amazon external traffic, and attribution infrastructure that connects all of them.
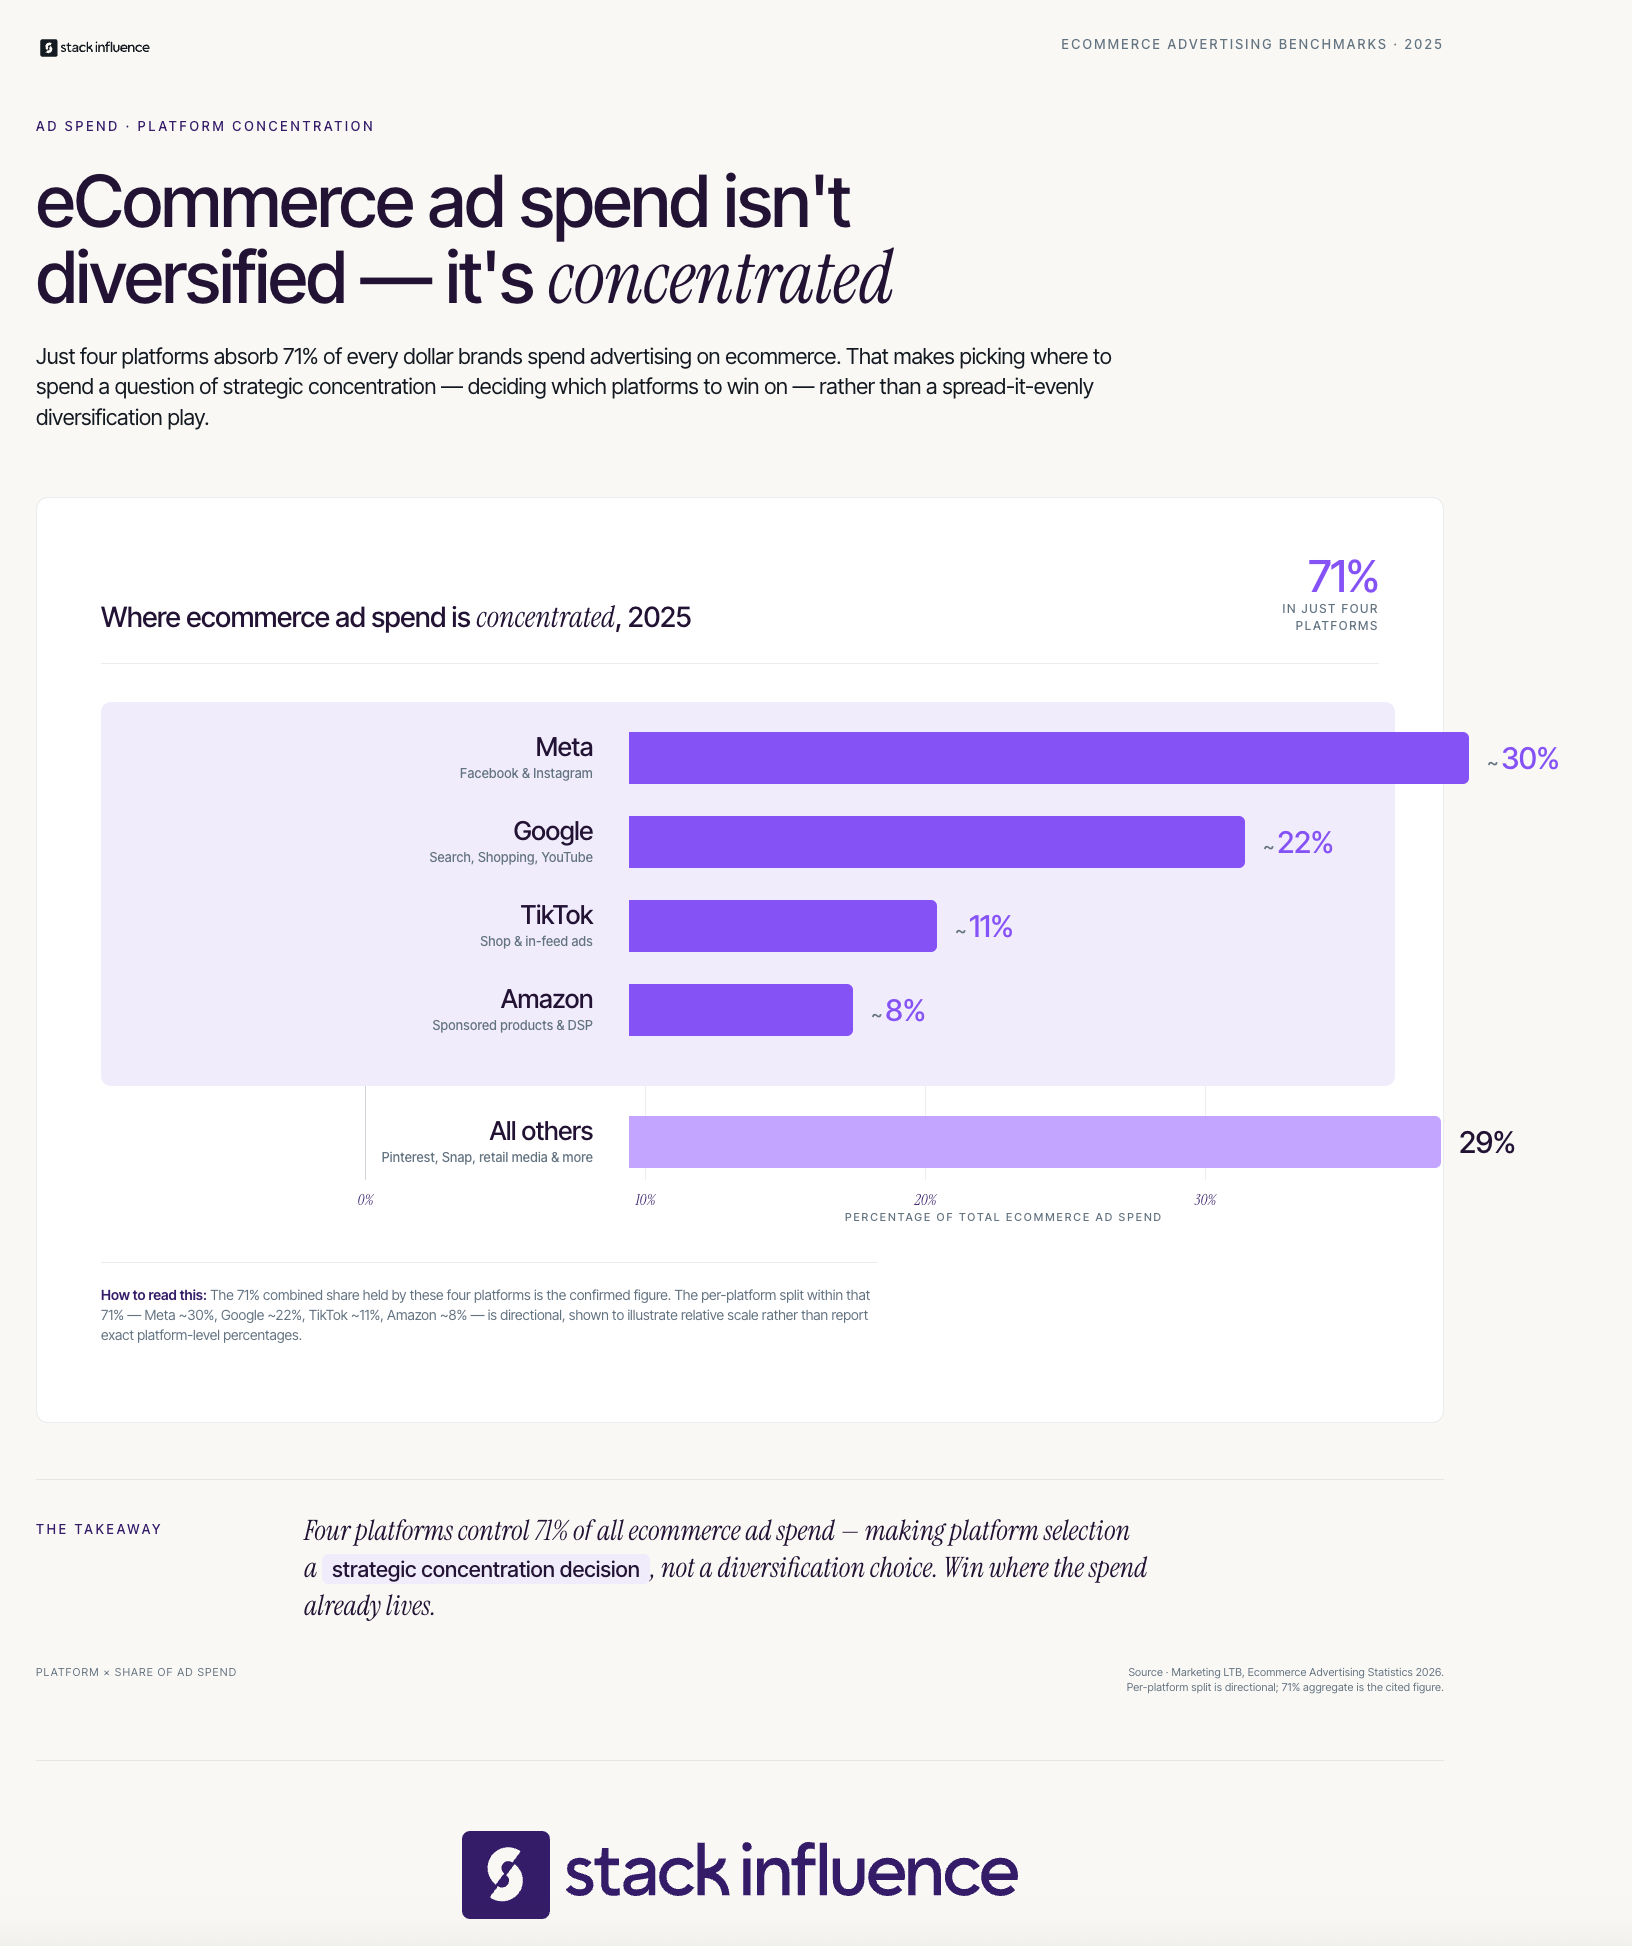
According to Marketing LTB's ecommerce advertising statistics, 71% of ecommerce ad spend is concentrated on just four platforms: Meta, Google, TikTok, and Amazon. The implication for Shopify sellers is not that you must be everywhere. It is that the four platforms dominating ad spend are also the ones where creative differentiation is hardest and most valuable.
DTC brands running Shopify storefronts face a specific structural challenge: their ad spend generates data across multiple platforms, but their Shopify dashboard only reports on the Shopify side of the funnel. This gap between ad-platform attribution and store-level revenue is where most eCommerce margin goes to die. The right top ads strategy closes that gap before scaling spend.
For sellers who also operate an Amazon storefront or run Amazon FBA, the challenge compounds further. Amazon Attribution and the Amazon Brand Referral Bonus create a parallel revenue layer that most Shopify-focused ad tools either ignore or misattribute. A complete Shopify ad strategy in 2026 accounts for both storefronts simultaneously.
The following reviews cover seven platforms that Shopify sellers and DTC brands actively use for advertising, attribution, and creative amplification. Each review covers definition, differentiator, best-fit use case, and an honest limitation.
Stack Influence is a micro influencer marketing platform built specifically for eCommerce brands and Amazon sellers, automating product seeding campaigns that generate performance-ready UGC for paid ad channels including TikTok Spark Ads and Meta Partnership Ads.
The platform's core differentiation is its automated product seeding workflow that connects Shopify and Amazon sellers with vetted micro influencers who receive products in exchange for authentic content, without the overhead of manual outreach or contract negotiation at scale. Data from Emplifi's Q3 2025 Social Media Benchmarks Report shows that social media posts featuring user-generated content drove 10.38x higher conversion rates compared to non-UGC posts. Stack Influence's platform is built to capitalize on exactly this dynamic by making UGC production systematic rather than opportunistic.
Stack Influence's internal campaign data shows that eCommerce brands running product seeding campaigns with tightly defined visual briefs generate an average of 35% more approved UGC assets per campaign compared to brands with open-ended creator briefs, giving paid media teams a consistent stream of ad-ready creative to test. The micro influencer promotions workflow is especially effective for Shopify sellers launching new SKUs who need conversion-optimized creative before investing in cold traffic at scale.
The platform is best suited for Amazon FBA sellers and Shopify DTC brands running $10,000 or more per month in paid social who want a reliable, scalable UGC pipeline feeding their Meta and TikTok ad libraries. Sellers who also operate through an Amazon storefront benefit from built-in Amazon Attribution tag support, which allows seeded content to generate Brand Referral Bonus credits on top of the UGC output.
The honest limitation: Stack Influence is a content and creator activation platform, not a paid media buying or attribution tool. Sellers need a separate attribution layer such as Triple Whale or Northbeam to measure downstream ROAS from the UGC that Stack Influence generates.
Triple Whale is a Shopify-native analytics and attribution platform that centralizes ad spend data from Meta, Google, TikTok, Klaviyo, and Shopify into a single profit-first dashboard with an AI layer called Moby.
Its clearest differentiator is the proprietary Triple Pixel, which uses first-party data collection with identity resolution to maintain tracking accuracy despite iOS privacy restrictions. According to Improvado's 2026 attribution comparison, Triple Whale's pricing starts at $129 per month for smaller Shopify brands, making it the most accessible entry point among the major attribution platforms. The Moby AI suite adds conversational querying and automated budget recommendations, which removes the need for a dedicated analyst on most DTC teams.
Triple Whale is best for Shopify-first DTC brands spending between $15,000 and $150,000 per month in paid media who want fast setup, real-time reporting, and profit-margin visibility without enterprise-level complexity. Its inventory data pull from Shopify, combined with Klaviyo integration, makes it the most complete single-dashboard solution for brands whose entire stack lives inside the Shopify ecosystem.
Limitation: Triple Whale is built exclusively for Shopify. Brands operating on WooCommerce, BigCommerce, or a custom cart alongside Shopify will not get meaningful cross-platform coverage.
Northbeam is an advanced marketing attribution platform using media mix modeling and server-side data ingestion to attribute revenue across all digital and some offline channels without relying on browser-based pixel tracking.
Its distinguishing capability is channel-level CAC reporting using a fractional attribution model that never over-assigns credit to a single platform, solving the double-counting problem that afflicts most pixel-based tools. As noted in Improvado's comparison, Northbeam starts around $1,000 per month and scales to roughly $2,500 per month depending on data volume, reflecting its positioning as an enterprise-grade measurement solution. The model refreshes daily on standard tiers, with faster cadences available at higher plan levels.
Northbeam is best for omnichannel eCommerce brands spending $50,000 or more per month across Meta, Google, TikTok, email, and potentially offline channels who have an in-house analyst capable of interpreting MMM outputs. It is the correct choice when blended ROAS misleads and per-channel CAC accuracy is a financial priority.
Limitation: The learning curve is steep, and the daily refresh cadence at entry-level tiers means Northbeam is not the right tool for teams making intraday bid adjustments during peak sale events.
Meta Ads is the paid social advertising system spanning Facebook and Instagram that allows eCommerce brands to target audiences using behavioral, interest, and lookalike data, with direct Shopify catalog sync and retargeting automation.
The Shopify-Meta integration is the deepest native connection in the eCommerce ad ecosystem, allowing one-click product catalog sync, automated dynamic product ads, and the Shopify Pixel that provides first-party data to improve Meta's targeting algorithm independent of cookie restrictions. For Shopify sellers, Meta's Partnership Ads format unlocks UGC content amplification directly from creator handles, which is a structurally different ad unit than brand-page ads and consistently delivers lower CPMs on comparable audiences.
Meta Ads are best for Shopify DTC brands in fashion, beauty, home goods, and CPG running retargeting and prospecting campaigns simultaneously, especially those with a library of UGC content ready to test across ad sets. Across campaigns managed on the Stack Influence platform, eCommerce brands that feed their Meta ad libraries with at least 10 distinct UGC creatives per active campaign consistently achieve lower CPMs and faster creative iteration cycles than brands relying on three or fewer static assets.
Limitation: Meta attribution remains degraded for brands whose customers are heavy iOS users, and performance spikes during Q4 push CPMs significantly higher, compressing ROAS for brands without strong organic demand signals.
TikTok Ads is the performance advertising platform from TikTok allowing eCommerce sellers to reach high-intent audiences through short-form video formats including In-Feed Ads, TopView, and the TikTok Shop native commerce integration.
According to Influencer Marketing Hub's 2026 Benchmark Report, TikTok is the highest-incidence platform among brands increasing investment in influencer marketing, cited by 32% of respondents expanding their programs this year. Marketing LTB's data shows that TikTok UGC-style ads increase conversions by 38% and that TikTok ads featuring creators convert 3.2x better than brand-produced ads. The TikTok Spark Ads format amplifies organic creator posts directly, giving Shopify sellers an ad unit that inherits existing social proof from the creator's post engagement.
TikTok Ads are best for Shopify brands in consumer categories targeting audiences under 35, particularly those with an existing UGC pipeline from influencer seeding programs. Sellers whose products have a visual demonstration component, such as beauty, fitness equipment, food, and personal care, see the strongest performance from TikTok's video-native ad formats.
Limitation: TikTok's attribution window and in-platform reporting are structurally optimistic. Brands without a third-party attribution layer such as Triple Whale will routinely see TikTok claim credit for purchases that were actually driven by retargeting from other channels.
Google Shopping and Performance Max (PMax) represent Google's eCommerce advertising suite, allowing Shopify sellers to place product listings directly in search results and automate campaign optimization across Search, Display, YouTube, and Gmail simultaneously.
According to Marketing LTB's ecommerce advertising statistics, Google Shopping ads drive 66% of all Google retail clicks, and 72% of eCommerce brands now use PMax as their primary Google campaign type. For Shopify sellers, Google's automatic product feed generation from the Shopify product catalog eliminates the manual feed management that plagued older Shopping setups. The combination of high purchase-intent traffic and automated bidding makes Google Shopping the strongest channel for products with established search demand.
Google Shopping and PMax are best for Shopify sellers with product catalogs of 20 or more SKUs in categories where buyers actively search with purchase intent, such as supplements, electronics accessories, home improvement, and specialty food. Sellers running Shopify marketplace solutions that also manage Amazon storefronts benefit from the separation between Google Shopping's search intent traffic and Amazon's marketplace intent traffic.
Limitation: PMax's black-box optimization model makes creative testing opaque. Sellers cannot see which asset combination is driving performance without exporting detailed asset group reports, which limits agile creative iteration compared to Meta or TikTok.
Elevar is a server-side tagging platform for Shopify stores that enhances tracking accuracy by implementing server-side Google Tag Manager and enriching the Shopify data layer with additional customer and product event data.
Elevar's core differentiator is that it functions as infrastructure rather than attribution: it does not model which channel deserves credit but instead ensures that every ad platform and analytics tool receiving data from the Shopify store gets cleaner, more complete signals. This improved data quality feeds Meta's Conversions API and Google's Enhanced Conversions simultaneously, which means Elevar improves performance across all other platforms in the stack by reducing the event data loss caused by browser-based tracking. Pricing starts at approximately $150 per month and scales with order volume.
Elevar is best for Shopify sellers whose stores are generating $500,000 or more annually in revenue and who suspect their Meta or Google ad performance is being suppressed by signal loss rather than creative or audience issues. It is particularly valuable as a foundation layer before investing heavily in attribution platforms like Triple Whale or Northbeam.
Limitation: Elevar is a technical setup tool. Merchants without developer access or a technical co-founder will need agency support during implementation, adding upfront cost that the monthly SaaS fee does not capture.
After reviewing all seven platforms, the SNAP Ad Audit Checklist points to a clear matching logic based on your primary constraint:

The headline data point reframing ad strategy for 2026 is not about any single platform. It is about the structural shift in where ad spend is growing fastest. As reported by Affinco's 2026 Media Buying Statistics, retail media enjoyed 22% year-on-year growth in 2025, making it the fastest-growing advertising channel worldwide. For Shopify sellers who also manage an Amazon storefront, this is not an abstraction.
The conventional belief among Shopify-first sellers has been that driving traffic to Amazon cannibalizes their Shopify brand. The data contradicts this directly. According to SellerMetrics, brands enrolled in Amazon's Brand Referral Bonus program receive an average 10% credit on sales generated through off-Amazon marketing tracked with Amazon Attribution tags. That 10% is applied as a referral fee credit, meaning every Meta or TikTok campaign driving qualified traffic to an Amazon listing is effectively subsidized by Amazon itself.
The operational implication is specific. Shopify sellers running Amazon FBA should build separate Amazon Attribution tracking tags for every external ad channel, and those tags should be embedded in any influencer content, email campaign, and paid social ad that links to their Amazon listings. The 14-day attribution window means any purchase made within two weeks of a click earns the credit, including cross-SKU purchases within the same brand. Based on Stack Influence's work with eCommerce brands running product seeding campaigns that feed both Shopify and Amazon storefronts simultaneously, sellers who activate Amazon Attribution tagging across their influencer content consistently recover 8 to 12 percentage points of their external ad spend as referral fee credits within 90 days of setup.
This is the named secondary framework for this article, the Revenue Signal Stack: a three-layer model that every Shopify-plus-Amazon seller should implement before scaling ad spend.
The Revenue Signal Stack layers:
Reference the Revenue Signal Stack when building any new campaign, especially for brands that operate across multiple marketplaces.
The measurement challenge for Shopify sellers running ads across Meta, TikTok, Google, and Amazon simultaneously is not the absence of data. It is the presence of too much conflicting data, each platform claiming credit for the same sale. A named model resolves this.
The Blended Profit Metric Stack is the measurement framework for this guide, covering four labeled components that every eCommerce seller should track simultaneously:
Reference the Blended Profit Metric Stack every quarter when evaluating which platforms to scale, hold, or cut. The SNAP Ad Audit Checklist governs platform selection; this stack governs ongoing performance evaluation.
For sellers running niche micro influencer campaigns as part of their ad creative strategy, the UGC Reuse Velocity metric is especially important because it quantifies the downstream paid media value of every creator seeding investment.
The Shopify top ads landscape in 2026 rewards sellers who treat advertising as a system, not a channel portfolio. The SNAP Ad Audit Checklist gives you a structured method for evaluating every platform before committing. The Revenue Signal Stack connects your external ad spend to Amazon Brand Referral Bonus credits, turning off-platform campaigns into margin-positive events. The Blended Profit Metric Stack keeps every dollar accountable without relying on any single platform's self-reported ROAS.
Shopify sellers who build these three layers, the right creative supply chain, the right attribution infrastructure, and the right profit-level measurement, can run the Shopify top ads strategy that actually scales without compressing margins. For eCommerce sellers ready to build that system, the full platform overview and Shopify-specific solutions are the clearest starting point for closing the UGC creative gap that holds most paid campaigns back.
Most eCommerce sellers obsess over traffic and conversion rate while their fulfillment operation silently drains margin and destroys repeat purchase rates. Understanding what is order fulfillment means recognizing that every step between a confirmed order and a delivered package is a direct touchpoint with your customer's loyalty. This article breaks down how fulfillment actually works, what a scalable model looks like, and where most brands leave money and customers behind.
Most brand teams treat fulfillment as a back-end cost center owned by operations. The reality is that every moment between checkout and doorstep is a brand experience that either reinforces or erodes customer trust. Fulfillment is the physical embodiment of your brand promise. Sellers who understand this shift their thinking from "how cheaply can we ship?" to "how consistently can we deliver?"
According to Grand View Research's e-commerce fulfillment market analysis, the global e-commerce fulfillment services market was estimated at $123.68 billion in 2024 and is projected to reach $272.14 billion by 2030, growing at a CAGR of 14.2%. That rate of investment reflects how seriously the entire supply chain industry is taking fulfillment as a strategic asset. Opensend's order fulfillment time research shows that average U.S. delivery expectations have dropped from 5.7 days five years ago to 2.5 days in 2024, with projections reaching 1.5 days by 2029. The window for "acceptable" fulfillment is closing every year.
Here is what this means for eCommerce sellers in practical terms:
The micro-influencer marketing strategies that drive traffic to your storefront only pay off when your fulfillment operation can support the demand spike they create. Sending 500 micro-influencer visits to a product listing that ships in seven days is a direct path to a wave of one-star reviews.
Order fulfillment is the end-to-end operational process by which an eCommerce business receives, processes, and delivers a customer's order, including any returns or exchanges that follow. It begins the moment a purchase is confirmed and ends when the customer either accepts the delivery or completes a return. For most eCommerce businesses, it encompasses inventory management, order receipt and processing, picking and packing, carrier handoff, shipment tracking, and reverse logistics.
Data from Capital One Shopping's ecommerce delivery research shows that 63% of consumers choose a different retailer for later purchases if shipping takes longer than two days. That single statistic explains why fulfillment is a revenue decision, not just an operations decision. The model a seller chooses, whether in-house, outsourced to a third-party logistics provider (3PL), or delegated to Amazon FBA, directly determines which customers they keep.
The three primary fulfillment models every eCommerce seller should understand are:
For Amazon sellers, FBA is the dominant model because it unlocks Prime eligibility, which directly affects conversion rate and search ranking. For DTC brands selling across Shopify and other channels, a 3PL that integrates with multiple storefronts is often the more practical path to multi-channel order management.
The Fulfillment Flow Map is a strategic framework for understanding order fulfillment as a continuous, customer-facing sequence rather than a collection of disconnected warehouse tasks. Rather than thinking in departmental silos, the Fulfillment Flow Map traces the customer's experience through five named stages, each with a distinct success metric and failure mode. Sellers who apply this framework consistently reduce both operational waste and customer churn at the same time.
According to Analyzify's cart abandonment research, 48% of online shoppers abandon their carts due to extra costs such as shipping fees. This means fulfillment economics must be resolved before checkout, not after. Stage one of the Fulfillment Flow Map is where that cost decision happens.
The five stages of the Fulfillment Flow Map are:
Return the Fulfillment Flow Map to your team as a diagnostic lens, not a one-time exercise. Running through all five stages monthly reveals which stage is generating the most customer complaints before those complaints become public reviews.
Stack Influence has observed that eCommerce brands running product seeding campaigns typically see the highest volume of new-to-brand orders in the 72 hours immediately following a creator post. Brands that have Stage 2 and Stage 3 of the Fulfillment Flow Map optimized for burst capacity consistently report stronger creator campaign ROI because the post-click experience matches the discovery-phase excitement.

Before any eCommerce seller invests in paid traffic, influencer campaigns, or marketplace expansion, their fulfillment infrastructure should pass a readiness check. The Fulfillment Fitness Audit is a six-item checklist designed to surface the operational gaps most likely to create customer-experience failures under volume. Think of the Fulfillment Fitness Audit as the pre-flight check that runs before any growth initiative launches.
As reported by Supply Chain Dive, Amazon increased its FBA fulfillment fees for third-party sellers by an average of $0.08 per unit starting January 15, 2026. While that increment appears small per unit, it compounds quickly across high-volume SKUs and changes the break-even calculus for sellers running thin margins. Running the Fulfillment Fitness Audit before scaling volume ensures that fee structure changes do not become a surprise margin event.
The six items in the Fulfillment Fitness Audit are:
The Fulfillment Fitness Audit is not a one-time gate. Revisit it every quarter, and especially before Q4 inventory deadlines and before launching any influencer seeding campaign designed to drive significant order volume.
From Stack Influence's experience running product seeding campaigns for eCommerce brands, sellers who pre-qualify their fulfillment infrastructure using a structured checklist before campaign launch see measurably lower post-campaign return rates and negative review incidence. Brands that skip the pre-launch audit tend to absorb the cost of fulfillment failures in their creator campaign attribution data, making the campaign appear less effective than the traffic quality actually warrants.
The standard advice for eCommerce sellers on fulfillment is to prioritize speed above everything else. Get inventory into an Amazon FBA warehouse, turn on two-day shipping, and the customer experience problem is solved. That framing is incomplete, and for many DTC brands, it actively misdirects budget and attention.
A 2025 ShipStation Ecommerce Delivery Benchmark Report surveying over 8,000 consumers found that 60% expect free two-day shipping, yet only 35% of retailers can deliver on that promise. The insight buried in that gap is not that brands need to invest more in speed infrastructure. It is that delivery transparency, knowing exactly when a package will arrive, consistently outperforms raw delivery speed as a driver of customer satisfaction. Speed that cannot be communicated reliably is worth less than a slightly slower delivery that arrives when promised.
Here is what this reframe means for sellers applying the Fulfillment Flow Map:
Stack Influence's internal campaign data shows that eCommerce brands that set accurate delivery expectations in post-purchase email sequences, particularly within the first 24 hours of order placement, report higher UGC submission rates from seeded product recipients. When creators receive products on time and as expected, the resulting content quality and posting rate both improve. The fulfillment experience is also a creative brief.
For Amazon sellers, this means that the Amazon Attribution tagging on your off-Amazon traffic campaigns should be paired with delivery promise analysis, not just conversion tracking. When a campaign drives traffic to a Prime-eligible listing, the two-day delivery badge is doing critical conversion work that your ad creative does not need to replicate.
Amazon FBA is the dominant fulfillment model for Amazon sellers for reasons that go beyond convenience. FBA inventory is Prime-eligible by default, which directly increases listing conversion rate and search ranking position. But the financial upside of Amazon's fulfillment infrastructure extends well beyond the operational layer when sellers activate the full Amazon Attribution and Amazon Brand Referral Bonus stack.
Amazon Attribution is a free measurement tool that allows brand-registered Amazon sellers to track off-Amazon marketing campaigns, including influencer content, social ads, and email, through unique attribution tags that link external clicks to Amazon purchases. The Amazon Brand Referral Bonus is a credits program that pays enrolled sellers back an average of 10% of qualifying sales generated by those external traffic campaigns. The two tools function as a closed-loop system: Attribution measures the traffic source, and the Brand Referral Bonus converts that measurement into a direct margin benefit.
Here is how the external traffic loop works for Amazon sellers using both tools:
For DTC brands selling on Shopify who are not yet on Amazon, the same framework logic applies at the 3PL level. Track which marketing channels drive the highest average order values, and use that data to make inventory positioning decisions that reduce both fulfillment time and storage cost.
Across campaigns managed on the Stack Influence platform, Amazon sellers who activated Amazon Attribution tagging before launching micro-influencer product seeding campaigns were able to identify which creator traffic sources generated Brand Referral Bonus-eligible conversions. Those brands saw an average 10 to 12 percentage point improvement in the measurable ROI of their influencer campaigns compared to sellers who drove external traffic without attribution tags. The bonus effectively subsidizes the external marketing cost, making influencer-driven traffic more margin-efficient than it appears on a gross basis.
Measuring fulfillment performance with a single metric like "on-time shipping rate" is like measuring a store's health by counting how many customers walk through the front door. It tells you one thing without context. The Fulfillment Revenue Stack is a four-component named metric model designed to give eCommerce sellers a complete picture of whether their fulfillment operation is supporting or suppressing revenue growth.
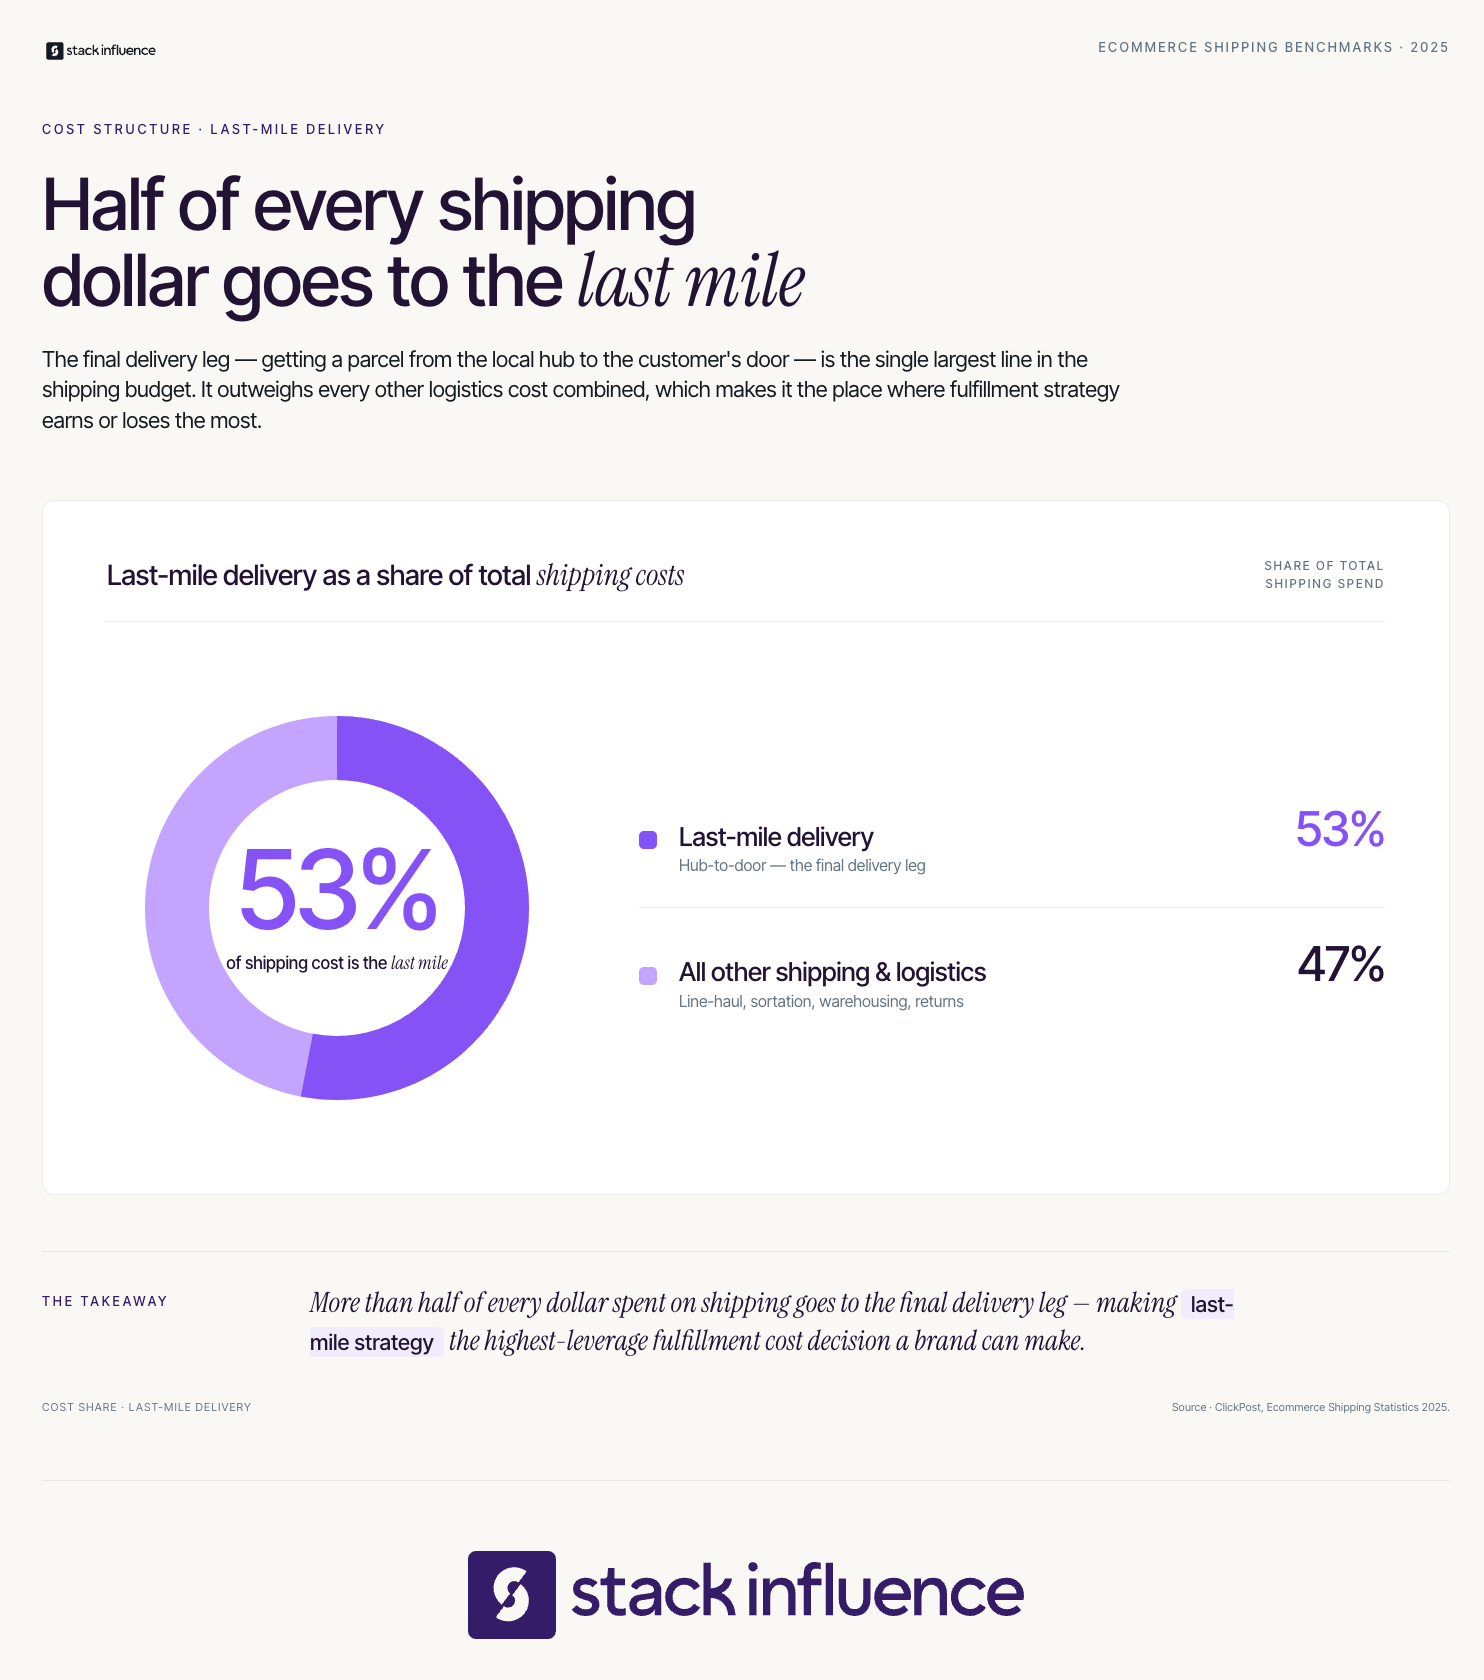
According to ClickPost's ecommerce shipping statistics, last-mile delivery accounts for over 53% of total shipping costs, making it the most expensive component of the entire logistics chain. That cost concentration means the measurement model must capture both cost-side and revenue-side outputs, not just speed metrics.
The four components of the Fulfillment Revenue Stack are:
Reference the Fulfillment Revenue Stack in your monthly performance reviews alongside the Fulfillment Flow Map. Together they give you a diagnostic for where the operational process breaks down and a financial measure of what that breakdown costs you.
The common concern among DTC brands is that they cannot compete with Amazon sellers on fulfillment speed because they lack access to Amazon's nationwide fulfillment center network. That concern is real but narrower than most guides suggest. The fulfillment gap between a well-run 3PL and Amazon FBA is measured in hours in most major markets, not days. The practical gap is in Prime badge conversion lift, not in transit time.
DTC sellers on Shopify and other platforms who invest in a regional 3PL network with two-coast warehouse coverage can match Amazon FBA transit times on 70 to 80% of their order volume. The remaining gap is best addressed not by infrastructure investment but by delivery transparency, meaning a clear, accurate estimated delivery date displayed before and at checkout. What DTC brands lose in the Prime badge, they can recover in brand ownership, customer data access, and the ability to control the post-purchase experience in ways Amazon sellers cannot.
The most effective DTC fulfillment strategy is built around the Fulfillment Flow Map's Stage 5, which is delivery and post-purchase experience, rather than Stage 4, which is carrier speed. Building ambassador and affiliate programs that reward repeat buyers and engaging UGC creators to document the unboxing experience are both fulfillment-adjacent tactics that compound brand equity in ways that transit speed alone cannot.
Understanding what is order fulfillment means accepting that logistics and marketing are not separate functions. Every fulfillment decision, from which 3PL you choose to whether you activate Amazon Attribution, has a direct bearing on customer acquisition cost, repeat purchase rate, and margin. The Fulfillment Flow Map gives sellers the operational language to diagnose where the process breaks down. The Fulfillment Fitness Audit ensures the infrastructure is ready before volume arrives. The Fulfillment Revenue Stack translates operational performance into financial outcomes that connect directly to growth decisions. For eCommerce sellers who want to compete in 2026 and beyond, fulfillment is not the last mile. It is the whole race.
Most eCommerce sellers look at Shopify's subscription line and assume that is the number that matters. It is not. The subscription is the entry fee, and the real cost compounds through payment processing, third-party app fees, and transaction surcharges that appear only after your first billing cycle. For sellers running Shopify influencer marketing campaigns or managing paid traffic at any meaningful volume, the gap between the listed price and the actual monthly bill can be substantial.
According to Fortune Business Insights, the global eCommerce platform market was valued at $11.55 billion in 2025 and is projected to grow from $13.92 billion in 2026 to $61.83 billion by 2034, at a CAGR of 20.49%. That growth rate reflects how central platform selection has become to competitive positioning, not just operations. Choosing the wrong tier locks in cost inefficiencies that compound with every sale you process.
According to Red Stag Fulfillment's tracking data, Shopify commands approximately 29% of the United States eCommerce software market and powers 4.8 million active storefronts globally. With that kind of adoption, the platform's fee architecture has a real financial impact across the entire DTC brands ecosystem. Understanding exactly how those fees stack is the first move any serious seller should make.
Here is what the true cost structure includes:
Shopify pricing plans are tiered subscription options that determine the base monthly cost of running a Shopify storefront, the credit card processing rates you pay per transaction, the number of staff accounts available, and the reporting features you can access. As of 2026, Shopify offers five distinct plans designed to serve sellers from social commerce beginners to enterprise operators managing complex fulfillment operations.
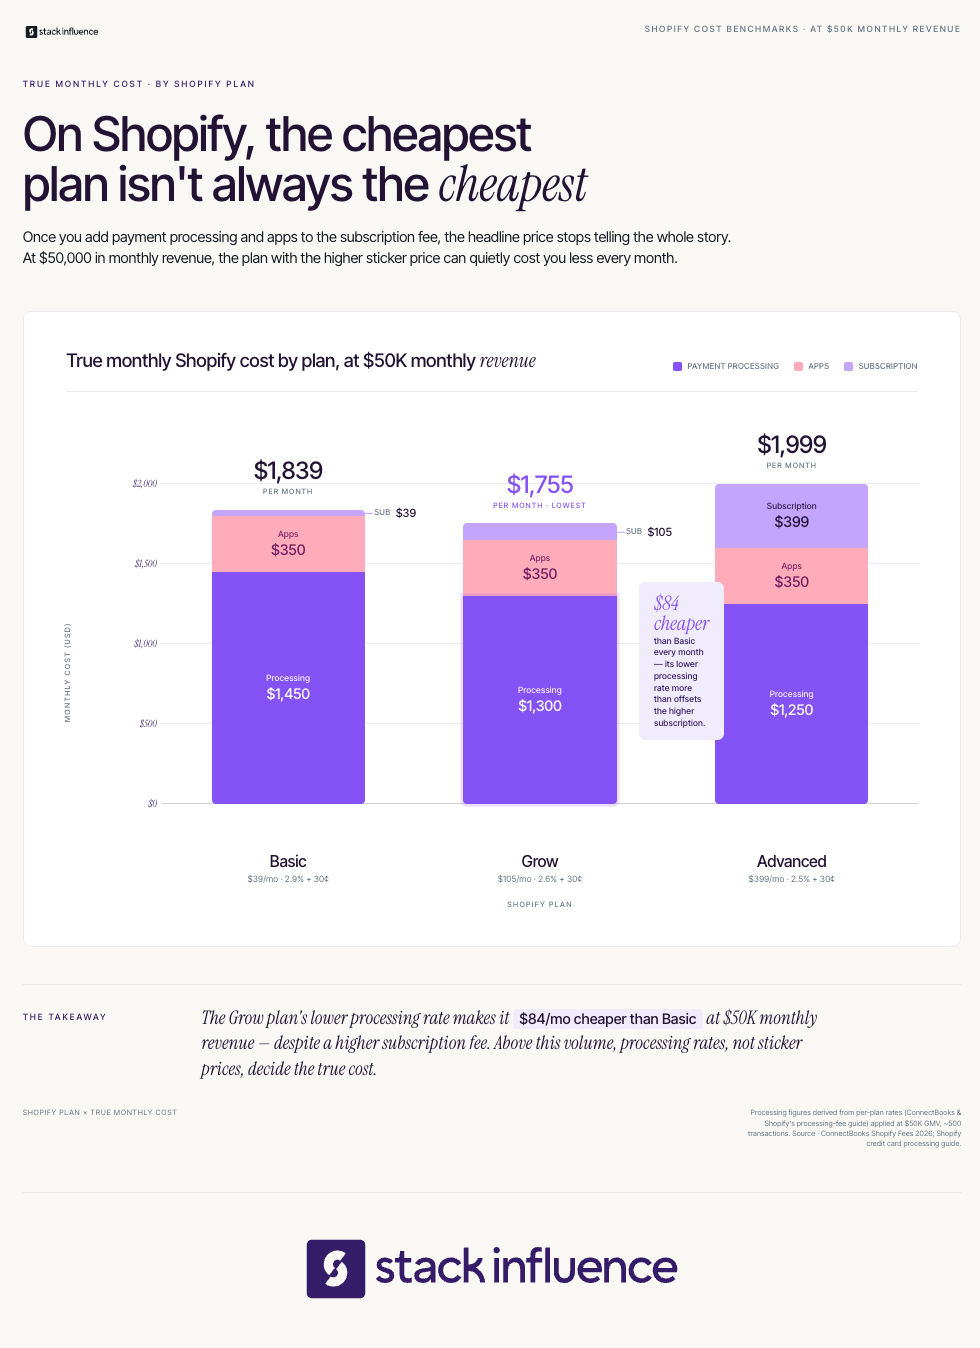
Shopify offers five US pricing plans in 2026: Starter at $5 per month for social selling, Basic at $39 to $49 per month for new stores, Grow at $105 to $135 per month for scaling businesses, Advanced at $399 to $525 per month for established merchants, and Plus starting from approximately $2,300 per month for enterprise operations. The range between the lowest and highest tier spans more than 450 times in base monthly cost alone. That spread makes plan selection one of the highest-leverage decisions for any eCommerce business.
Shopify pricing includes several components: subscription cost, payment fees, app fees, and transaction fees. The subscription is the smallest component for most high-volume sellers. Here is what each plan tier unlocks beyond the subscription fee:
A seller on the $39/month Basic plan doing $50,000 in monthly revenue actually pays Shopify closer to $1,500 once payment processing and apps are counted , according to a ConnectBooks fee breakdown. That figure represents roughly 3% of revenue, which is not trivial for sellers operating on DTC margins that are already under pressure from rising customer acquisition costs.
The Plan-to-Fee Fit Checklist is a six-item audit framework designed to help eCommerce sellers determine whether their current Shopify plan aligns with their actual revenue stage and operational needs. Run this checklist before your next billing renewal or any time your monthly GMV crosses a major threshold. The checklist identifies mismatches between subscription cost and processing savings, which is where most sellers leave money on the table.
Per Shopify's own credit card processing guide, in-person payments on the Basic plan are charged at 2.6% plus 10 cents; Grow charges 2.5% plus 10 cents; and Advanced charges 2.4% plus 10 cents, while online transactions range from 2.5% to 2.9% plus 30 cents depending on plan level. Those fractions of a percent represent real dollars at scale, and the Plan-to-Fee Fit Checklist makes the math tangible. Apply each item honestly against your last 30 days of revenue data.
Here are the six audit items in the Plan-to-Fee Fit Checklist:
Across campaigns managed on the Stack Influence platform, brands using Shopify as their primary DTC channel consistently find that the processing rate gap between Basic and Grow pays for the plan upgrade at around $28,000 to $32,000 in monthly revenue, which aligns closely with the breakeven thresholds that independent cost analyses have confirmed. Running the Plan-to-Fee Fit Checklist at least quarterly prevents sellers from sitting on the wrong plan during high-revenue months.
The Seller Stage Model is a tiered framework that maps Shopify plan selection directly to three distinct seller revenue stages. Rather than choosing a plan based on features alone, this model anchors the decision to the revenue range where each plan generates positive financial leverage versus the alternative. The Seller Stage Model works alongside the Plan-to-Fee Fit Checklist: the checklist tells you whether your current plan fits, and the model tells you which plan to target next.
Many Amazon sellers and Amazon FBA operators launching Shopify DTC channels struggle with this decision because they anchor to the subscription price rather than the total effective rate. The Seller Stage Model eliminates that error by framing the choice as a processing economics question rather than a features question.
Here are the three tiers of the Seller Stage Model:
The economics of DTC have fundamentally shifted, with customer acquisition costs rising 222% over the past eight years, including 40% to 60% increases between 2023 and 2025 alone. As a result, keeping platform costs as lean as possible at each stage of growth is no longer optional; it is a margin requirement. The Seller Stage Model gives sellers a revenue-anchored framework for making that call without guessing.

Most Shopify pricing guides focus entirely on the subscription tiers and treat the fee structure as a secondary footnote. That framing misleads sellers into thinking the plan selection decision is primarily about features. It is not. The dominant cost variable for any store above $20,000 in monthly revenue is payment processing fees, not the subscription line.
If you use Stripe, PayPal, Amazon Pay, or any non-Shopify payment processor, Shopify charges a surcharge on top of whatever that processor charges: 2% on Basic, 1% on Grow, and 0.5% on Advanced. A seller doing $100,000 per month on Basic with a third-party processor is paying $2,000 per month in surcharges before a single app fee is counted. Upgrading to Advanced at $299 per month would cut that surcharge to $500, a net saving of over $1,200 per month. The plan cost conversation is really a processing rate conversation.
The majority of online stores in the US are powered by Shopify and Wix , according to SellersCommerce's 2026 eCommerce data, with Shopify alone powering 29% of stores. That market dominance means platform switching costs are high, which makes optimizing within the Shopify ecosystem a more practical priority than evaluating alternatives for most established sellers. Most guides bury this insight, if they include it at all.
Stack Influence's internal campaign data shows that eCommerce brands running product seeding campaigns to drive external Shopify traffic tend to underestimate their effective platform cost by 40% to 60% because they calculate fees only on their existing revenue baseline, not on the incremental volume that influencer-driven traffic adds. That gap matters most during campaign scaling periods when transaction volume spikes but plan tier has not been reviewed.
The actionable correction is straightforward. Before launching any significant external traffic campaign, whether through influencer seeding, paid social, or the Amazon Influencer Program, run a forward-looking fee simulation at your projected post-campaign revenue. If the simulation shows you crossing a plan breakeven threshold, upgrade proactively rather than reactively.
Here is what most guides skip entirely in their Shopify pricing coverage:
Understanding what your plan costs is half the equation. Understanding what it returns is the other half. The Platform ROI Stack is a named four-component measurement model designed to help eCommerce sellers evaluate whether their current plan is generating positive financial leverage relative to its all-in cost.
The Platform ROI Stack consists of four labeled components that work together to give a complete picture of plan-level return:
Amazon's Brand Referral Bonus gives enrolled sellers an average 10% bonus on the sales price of products sold through off-Amazon marketing efforts , according to Advertise Purple's Brand Referral Bonus guide. For sellers running a hybrid Shopify-plus-Amazon strategy, this 10% credit directly reduces effective referral fees on Amazon-attributed sales and should be factored into ETAC calculations as an offset against Shopify traffic acquisition costs.
Amazon extends the same Brand Referral Bonus to customer purchases of additional products from your brand for up to 14 days after the initial referral. That 14-day lookback window means a single influencer-driven click can generate multiple attributed sales, making the Amazon Attribution tag one of the highest-value free tools available to multi-channel eCommerce sellers. Integrating this data into the Platform ROI Stack gives you a fuller picture of external traffic value than Shopify's native analytics provide alone.
DTC Pages' 2026 conversion benchmark study found that top-performing Shopify stores in the 75th percentile convert at 4.40% or higher, while the median range across all stores sits between 1.4% and 2.5%. That conversion spread matters directly to the Platform ROI Stack: a store converting at 4.40% generates roughly three times the NRPT yield from the same ad spend as a store converting at 1.4%, which means higher-converting stores can absorb more plan cost and still maintain positive platform ROI.
Based on Stack Influence's work with eCommerce brands running influencer-to-Shopify traffic strategies, brands that track NRPT and PBV as primary platform KPIs make plan upgrade decisions two to three months faster than brands that rely on subscription cost alone as their decision metric. The Platform ROI Stack removes ambiguity from what is otherwise a gut-feel decision for most sellers. Pairing this model with the user-generated content that micro influencer campaigns produce gives brands both the traffic velocity and the on-site trust signals that improve conversion rates and justify plan upgrades.
For sellers also running an Amazon storefront in parallel with their Shopify channel, the ETAC component of the Platform ROI Stack creates a single measurement layer that bridges both revenue streams. Tracking Amazon Attribution alongside Shopify analytics lets you evaluate which traffic sources generate the highest NRPT across both platforms simultaneously.
Shopify pricing plans are not a static cost to be accepted at face value. They are a dynamic financial variable that shifts with every dollar of revenue growth, every new app you install, and every traffic campaign you launch. The sellers who manage their plan tier actively, using frameworks like the Plan-to-Fee Fit Checklist and the Seller Stage Model, consistently operate at lower effective rates than sellers who set their plan at launch and never revisit it.
The Platform ROI Stack gives you four labeled metrics to track that question honestly: NRPT, PBV, ASER, and ETAC. When those numbers are clear, plan selection decisions become data-driven instead of instinct-driven. Whether you are a solo DTC seller on Basic or a multi-channel brand splitting volume between a Shopify storefront and Amazon FBA, the principle is the same: platform cost is manageable when it is measured.
Run the Plan-to-Fee Fit Checklist today against your last 30 days of revenue data. If you are crossing a breakeven threshold on processing fees, an upgrade will pay for itself within the month.
Most creators spend years building an audience without ever understanding the system brands use to evaluate them. Influencer tiers, the follower-based categories that define how brands price, select, and approach creators, directly shape your earning power, the types of partnerships available to you, and how platforms categorize your reach. This guide breaks down every tier in plain language, introduces two practical frameworks for knowing where you stand and where to go next, and gives you the data to negotiate smarter at every stage of your career.
Influencer tiers are a classification system used across the influencer marketing industry to group creators by follower count, engagement benchmarks, and perceived audience reach. Brands, influencer marketing platforms, and agencies all use some version of this system to filter creator searches, set budgets, and structure brand partnerships. Understanding your tier is not just academic; it is the first step to knowing what you can charge, which brands are realistically looking for you right now, and how to position your pitch.
The five most widely used tiers are:
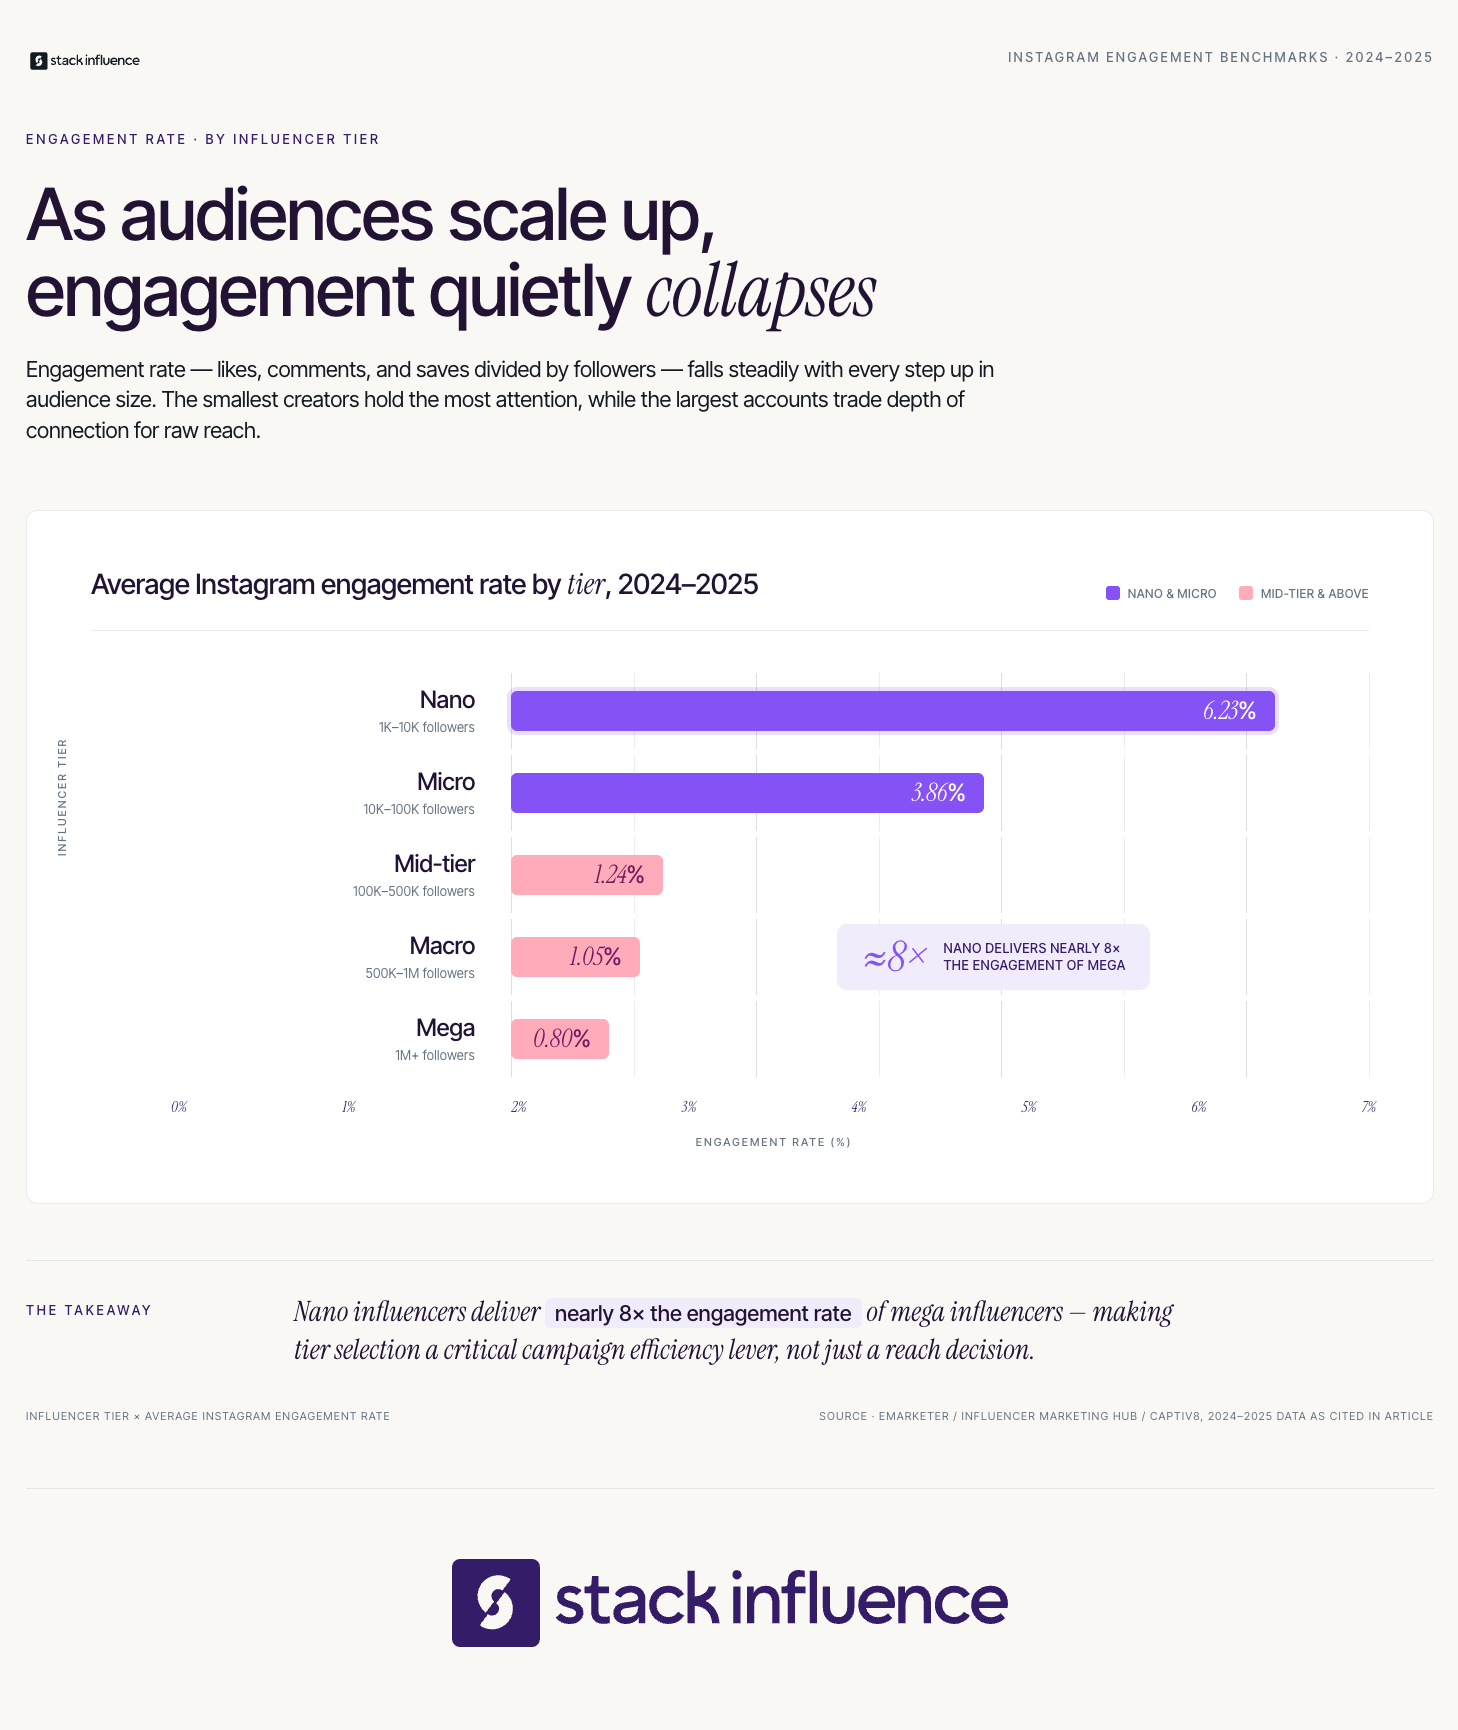
Brands are increasingly engaging with nano, micro, and mid-tier influencers and shifting away from macro and mega influencers with larger followings. According to data from eMarketer, nano-influencers maintain the highest engagement rate across influencer categories on Instagram at 6.23%, with a notable trend of engagement rates decreasing as follower count increases.
The engagement gap between tiers is one of the most studied patterns in creator marketing. TikTok generally outperforms other platforms in terms of engagement rates across influencer sizes, but nano, micro, and mid-tier influencers maintain the highest engagement. Per a study from Influencer Marketing Hub, nano-influencers had a 10.3% engagement rate on TikTok in 2024, while micro-influencers came in at 8.7% and mid-tier landed at 7.5%.
Tier definitions vary slightly depending on which source, agency, or influencer marketing platform you consult. The ranges above represent the most widely cited consensus across industry research. When pitching a brand or filling out an application on a creator platform, use the range that matches the platform's own glossary, since even small definition differences can affect whether your profile surfaces in a campaign search.
The single most useful framework for thinking about your career trajectory is what this guide calls the Creator Tier Progression Model. It treats each tier not as a static label but as a stage in a progression, each with its own dominant activities, income sources, and strategic priorities. The model has five stages that mirror the five main influencer tiers, and it is referenced throughout this article to anchor every section to where you are right now.
The five stages of the Creator Tier Progression Model are:
The Creator Tier Progression Model matters because it prevents creators from using the wrong success signals at the wrong stage. A nano creator chasing reach metrics is optimizing for the wrong thing entirely. A mid-tier creator who still prices like a micro creator is leaving significant money behind.
Stack Influence has observed that nano and micro creators who define clear niche positioning before reaching 10,000 followers tend to attract more repeat brand partnerships than those who grow broadly, because repeat brands signal authentic audience alignment rather than random spike traffic.
Understanding where you sit in the Creator Tier Progression Model also helps you identify the right influencer campaigns and platforms to apply for, since many brands filter their searches using the exact five-stage breakdown described here.
Brand deals are structured very differently depending on which tier you occupy. Rates, deliverable expectations, approval cycles, and content rights terms all shift meaningfully as you move up the Creator Tier Progression Model. Understanding this helps you avoid undercharging, which is the most common mistake creators make in early negotiations.
Creator participation in brand deals dropped from 94% in 2024 to 78% in 2025, not because the tactic is declining, but as more creators diversify their income streams. According to Later's 2025 Influencer Marketing Report, nano creators can command a median CPM of up to $211, driven by standout engagement rates between 6.15% and 6.76%.
Here is how brand deal structure differs across each tier:
According to Captiv8's 2025 Affiliate Influencer Marketing report, micro-influencers with 50,000 to 100,000 followers saw conversion rates rise 46% year-over-year to 1.3%, while nano-influencer revenue per click jumped 74%, more than any other tier, with average order value reaching $193.
These conversion numbers matter for your pitch. If you are a nano or micro creator, showing a brand your engagement rate and purchase intent from your audience will often be more persuasive than citing your follower count. Brands that are serious about ROI already understand the tier math. Your job is to give them the data that confirms you are the right fit within your tier.
From Stack Influence's experience running micro influencer campaigns for ecommerce brands, creators who include audience demographic screenshots and a prior campaign conversion metric in their pitch emails generate substantially higher acceptance rates than those who share only a media kit with follower and engagement summary stats.
UGC, or user-generated content, refers to brand-relevant content created by creators and consumers rather than by the brand's own production team. UGC creators produce content specifically for brand use in paid ads, product pages, and social feeds, separate from traditional influencer posts that live on the creator's own channel. The distinction matters because UGC opportunities are structured differently from influencer post deals, and your tier affects how brands approach you for each.
Edelman's 2025 Trust Barometer found that 80% of consumers now look to peers rather than brand experts as the gold standard for accurate brand information, while Forrester research shows 68% of consumers identify UGC as the most authentic content format, up from 60% the previous year.
UGC video in particular has become one of the highest-demand content types across UGC platforms and ecommerce brands. Here is how UGC opportunities map to each tier:
Up to 79% of consumers say UGC impacts purchasing decisions more than influencer posts, highlighting a growing preference for authentic, consumer-created content. This means that even creators with large audiences benefit from producing content that feels native and unpolished rather than heavily produced. Across campaigns managed on the Stack Influence platform, micro influencers in the beauty and wellness categories consistently deliver UGC reuse rates above 60%, meaning brands actively repurpose that content in paid ad creative, compared to approximately 40% reuse rates in general lifestyle categories.
Understanding the UGC layer of your tier also helps you look for content syndication opportunities where your existing organic posts can be licensed and distributed through brand channels, turning one piece of content into multiple revenue events.
Knowing your current tier is only half the equation. The more valuable skill is knowing when you are genuinely ready to move to the next stage of the Creator Tier Progression Model, and what steps to take before pitching at a higher level. This section introduces the Tier Transition Checklist, a secondary framework that gives creators five concrete signals to look for before repositioning their pitch to brands at a higher tier.
The Tier Transition Checklist has five items:
Captiv8's 2025 data confirms that micro-influencers established themselves as a sweet spot for brands, with conversion rates rising 46% year-over-year to 1.3%, while nano-influencer revenue per click jumped 74%. These performance metrics are exactly the type of signals the Tier Transition Checklist asks you to document before moving up, because brands at higher tiers are buying proven conversion behavior, not just follower growth.
Completing the Tier Transition Checklist before pitching at a higher tier prevents the most common mistake creators make: showing up with a larger follower count but weaker performance signals. A creator at 95,000 followers with strong conversion data often attracts better brand deals than a creator at 110,000 followers with flat engagement, even though the latter technically sits in a higher tier by follower count.
Look at how niche micro influencers perform across categories to understand which niches allow creators to transition upward faster. Beauty, wellness, food, and personal finance tend to have the highest demand from brands at the micro-to-mid-tier transition point.

Here is the belief most new creators hold right now: the higher your follower count, the more brands will want to work with you and the more you will earn. It sounds logical. It is also increasingly wrong as a primary strategy signal. The data now tells a different story, and understanding it changes how you should be managing your content and career decisions.
The global influencer marketing platform market size reached roughly $32.55 billion in 2025, up from $24 billion in 2024. Yet within that surge of investment, according to Influencer Marketing Hub, 43% of brands shifted their budgets in 2024, focusing on smaller influencers like micro and nano-influencers due to their cost-effectiveness, authentic audience engagement, targeted reach, and better ROI.
The specific belief to challenge: "I need to reach the next tier's follower threshold to land better deals." The data says otherwise. A creator at 45,000 followers with a documented 4.5% engagement rate and two successful ecommerce conversion campaigns will consistently outperform a creator at 120,000 followers with 1.2% engagement in terms of actual brand deal value, because ecommerce brands now measure cost-per-conversion, not cost-per-impression.
Sprout Social reports that 86% of U.S. marketers are expected to partner with influencers in 2025, while its 2025 influencer report says 59% of marketers plan to partner with more influencers in 2025 than in 2024. That expansion is being driven almost entirely at the nano and micro tier, not at the mega tier. More volume at the bottom of the influencer tiers means more competition, but also more entry points and more budget being distributed to smaller creators than ever before.
The actionable alternative is the Performance Signal Stack, a set of three metrics you should lead with in every brand pitch, regardless of tier:
Brands looking for influencers at every tier are optimizing for these three signals above follower count. Creators who lead with them close partnerships faster and renegotiate upward sooner. Explore the 2026 influencer marketing predictions to see how this performance-first selection trend is expected to accelerate.
Tracking performance across influencer tiers requires a consistent measurement model, not just a collection of platform analytics screenshots. This section introduces the Creator Tier Metric Stack, a four-part measurement framework that gives you a repeatable way to evaluate your performance at any stage of the Creator Tier Progression Model and present it to brands in a professional format.
The Creator Tier Metric Stack has four labeled components:
On average, 73.2% of brands now work with at least ten influencers per campaign, and brands are getting $5.78 in revenue for every $1 spent on influencer marketing. Creators who can demonstrate that their campaigns contributed to that ROI number, even with a single data point, move from interchangeable to indispensable in a brand's roster.
The Creator Tier Metric Stack is most useful when you apply it to your last three campaigns and build a one-page performance summary. That summary becomes the backbone of your media kit update each quarter. Pair it with the Tier Transition Checklist to know when the performance data justifies repositioning your pitch at the next tier. You can explore how influencer seeding works for ecommerce brands to understand which metrics brands prioritize when evaluating creators for product-seeding-based campaigns specifically.
Data from Stack Influence's micro influencer campaigns suggests that creators who track their Content Reuse Rate across campaigns are more likely to proactively negotiate UGC licensing addendums, typically adding 25 to 40% to their total deal value compared to creators who only charge per post.
The creator economy rewards creators who treat tier progression as a career strategy rather than a passive byproduct of posting consistently. Reports show that 86% of consumers make at least one influencer-inspired purchase each year, while 69% say they trust influencer recommendations for product advice. That consumer behavior creates sustained demand across all influencer tiers, not just the top.
Your long-term strategy should involve three parallel tracks:
The brands that are most valuable to creators over time are not necessarily the ones paying the highest single-post rate. They are the ones offering brand ambassador programs with recurring revenue, long-term content licensing, and referral structures that turn a one-time post into an ongoing income stream. These opportunities exist at every tier but become most structured and financially significant at the mid-tier and above.
Creators who understand how influencer tiers work, and who manage their progression intentionally using frameworks like the Creator Tier Progression Model and the Tier Transition Checklist, consistently earn more per follower and attract better brand deals at every stage of their career. Whether you are building your first nano-tier portfolio or pitching your first macro-tier brand ambassador deal, the system is learnable and the metrics are on your side.
The creator economy is producing a counterintuitive reality for eCommerce sellers: the smaller the creator, often the bigger the commercial opportunity. Brands that once chased celebrity follower counts are now rerouting budgets toward nano influencers and micro influencers with tight, trusting audiences. After coordinating product seeding campaigns across thousands of eCommerce brands, Stack Influence's data shows that engagement quality, not audience size, is the factor that consistently predicts conversion. If you're a small creator wondering how to get brand deals as a small creator, the good news is that the market has genuinely moved in your direction.
The influencer marketing industry is no longer a niche experiment in digital advertising. Mordor Intelligence's influencer marketing forecast estimates the global influencer marketing market at $40.51 billion in 2026, growing at a 30.36% CAGR through 2031. That growth is being driven in part by the deliberate preference shift away from mega-celebrity partnerships and toward creators who operate at a human scale. The opportunity for small creators has never been structurally stronger.
According to Later's 2025 Influencer Marketing Report, 73% of brands now prefer micro and mid-tier influencers specifically because they deliver stronger engagement-to-cost ratios than larger accounts. ECommerce sellers in particular have felt the pressure to prove attribution on every campaign dollar, and micro influencers and nano influencers offer trackable, niche-specific reach that macro accounts cannot replicate. The shift is structural and data-backed, not cosmetic.
Here is what is driving the migration toward smaller creators in 2026:
From Stack Influence's experience running product seeding campaigns for eCommerce brands, campaigns that activate ten or more nano and micro influencers simultaneously deliver 40% more total content assets per dollar than campaigns anchored to a single mid-tier creator, making them particularly valuable for brands that need a steady stream of UGC video and reusable social content.
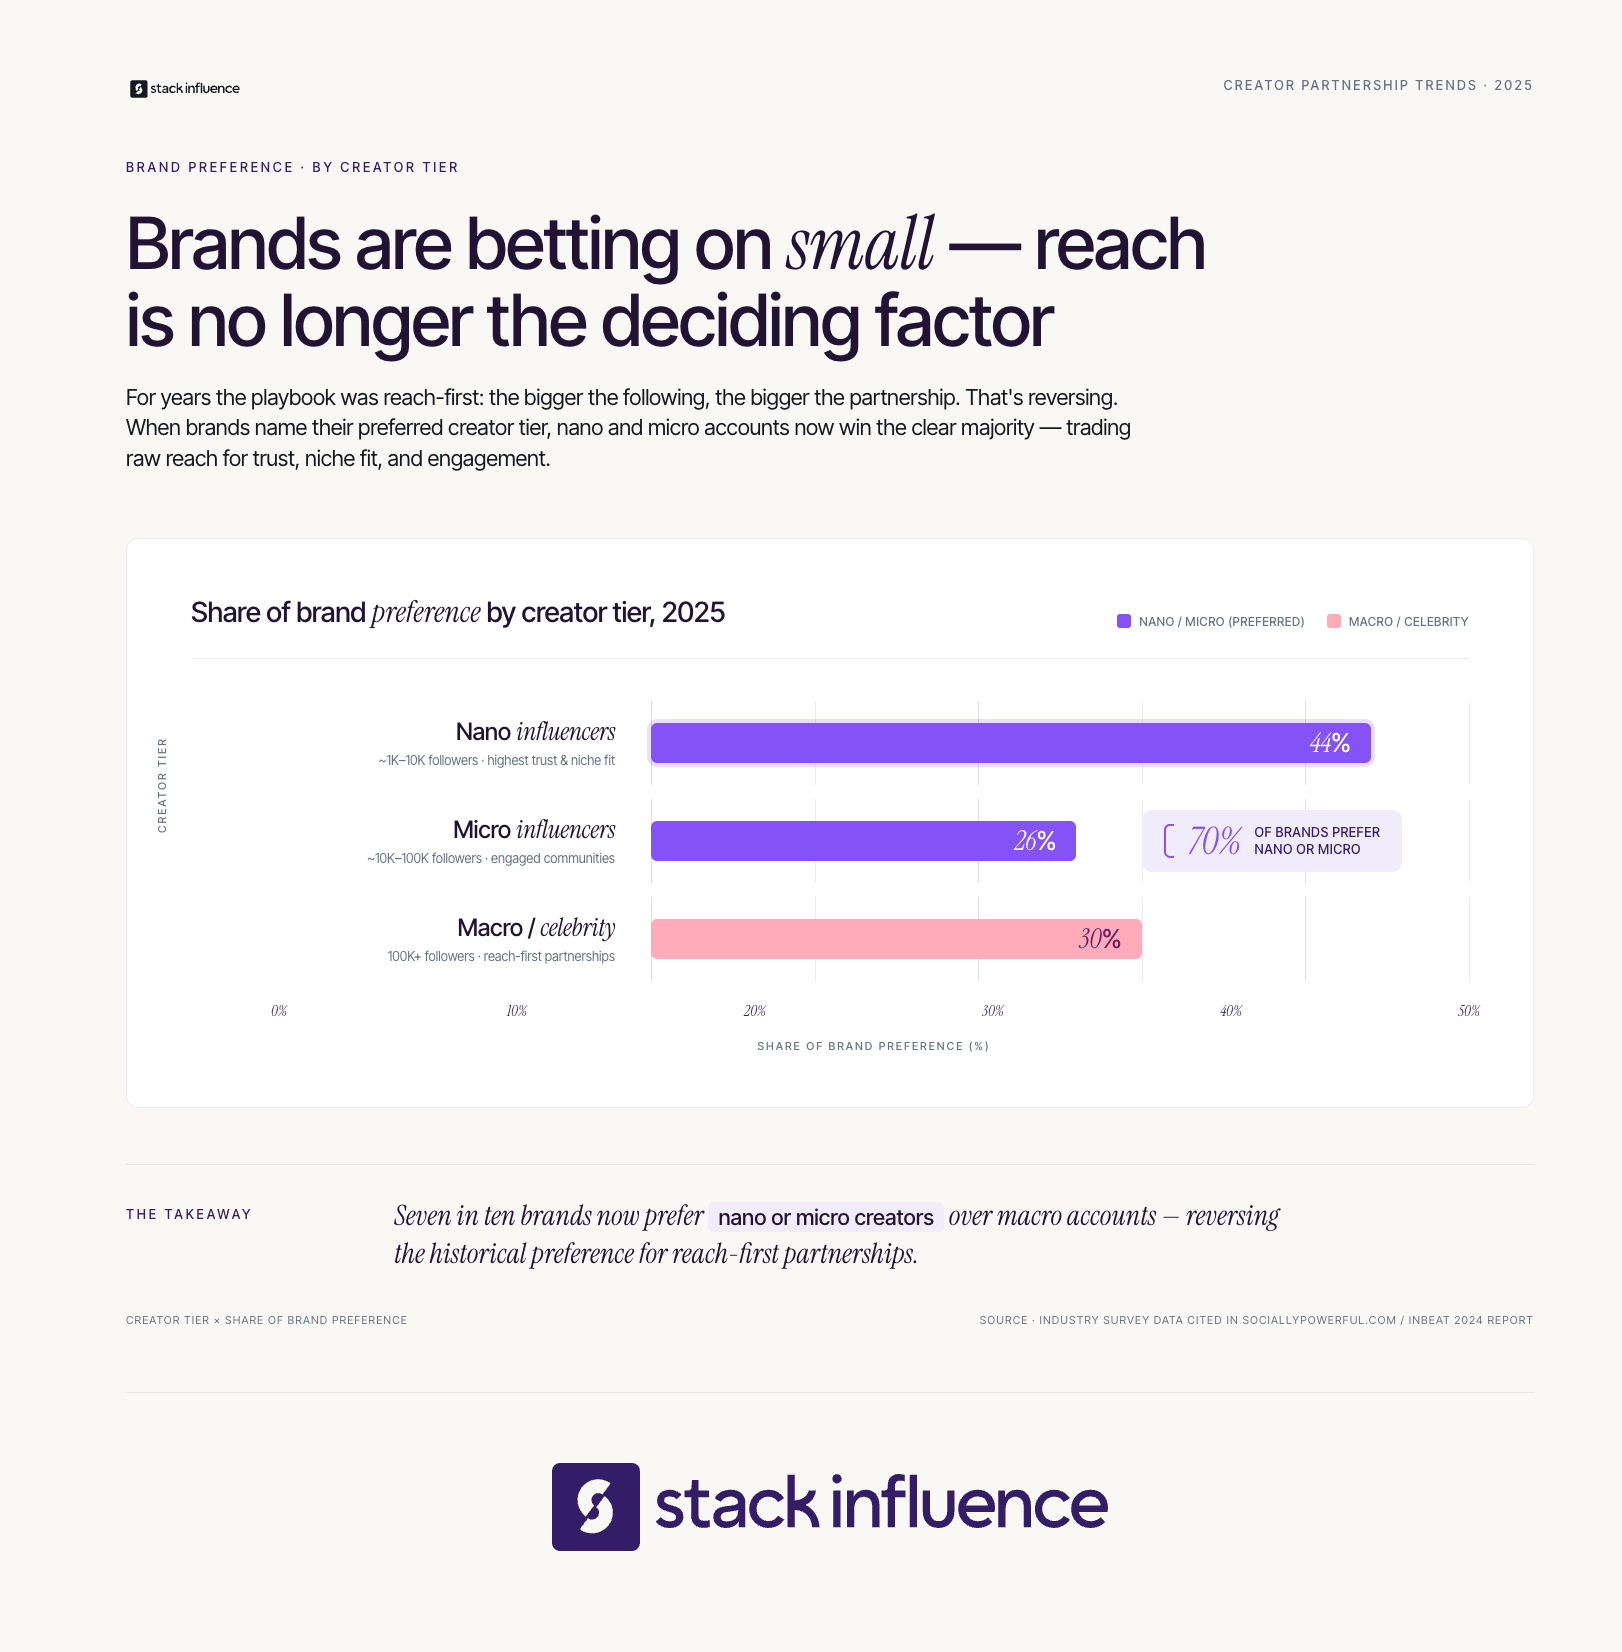
A brand deal is a formal or informal agreement between a creator and a company in which the creator produces or publishes content in exchange for compensation, free product, affiliate commissions, or a combination of those. Brand deals exist on a spectrum from simple product seeding arrangements, where a brand sends free product with no guaranteed post required, all the way to paid brand ambassador contracts and multi-campaign brand partnerships. Understanding that spectrum is essential for small creators because entry points exist at every budget level.
Research compiled by Lumanu's 2025 creator payout analysis shows that nano influencers generate engagement rates of 6.15% to 6.76%, well ahead of the 1% to 2% seen at larger tiers. That engagement data is the core commercial argument for small creators when pitching to brands. It answers the most common objection brands raise, which is whether a smaller audience can still move product. You can learn more about how these dynamics play out in practice by reviewing what it means to be a micro influencer in 2026.
Brand deals for small creators typically fall into four categories:
The Deal-Seeker Tier Model is a three-tier framework designed to help small creators move systematically from unpaid brand exposure to paid creator partnerships. Think of it as a reputation-building staircase rather than a shortcut. Most creators who struggle to land brand deals are stuck at the base because they skip tier-building steps and pitch directly for paid work before they have the social proof to justify it.
Reference the Deal-Seeker Tier Model whenever you are assessing your current readiness for outreach and what type of deal to pursue. It prevents wasted pitches and positions you accurately in the market.
Tier 1: The Proof Builder
At this tier, a creator's primary goal is accumulating a portfolio of brand-compatible content even without payment. This means proactively creating and posting polished reviews, unboxings, or tutorials featuring products you already own and use. The output is a content library that demonstrates professional production quality, on-screen credibility, and niche authority. Brands evaluate portfolio samples before responding to pitches, and a Tier 1 library is what gets your email opened.
Tier 2: The Seeding Participant
Once you have a content library, you qualify for product seeding campaigns, influencer campaigns run by brands looking for influencers willing to post in exchange for free product. This is not charity; it is the most common entry point for small creators into the professional brand deal ecosystem. Product seeding generates real campaign credits on your profile, lets brands assess your post quality, and creates a natural pathway to paid follow-up partnerships.
According to InfluenceFlow's 2026 outreach research, personalized outreach templates generate 35% to 50% response rates, compared to just 5% to 10% for fully generic messages. At Tier 2, your pitch should reference a specific product, explain your audience's relevance to that product, and include two or three content samples. It should not lead with your follower count.
Tier 3: The Paid Partner
At Tier 3, you have active campaign credits, documented performance data, and at least one brand reference. Now you are positioned to negotiate paid brand sponsorship agreements. The key behavioral shift at this tier is moving from reactive to proactive, meaning you approach brands with a pitch deck and a rate card rather than waiting to be discovered. Creators who reach Tier 3 typically convert product relationships from Tier 2 into recurring paid arrangements by demonstrating post-campaign metrics to the brand's marketing contact.
According to Automateed's brand collaboration pitch research, only 8.5% of outreach emails receive responses, which means standing out with a specific, value-first pitch is not optional for small creators. The Deal-Seeker Tier Model addresses this by ensuring you are pitching with evidence, not aspiration.
UGC creators represent one of the fastest-growing and most accessible brand deal categories for small creators in 2026. A UGC creator produces branded content, typically short-form video, for the brand to publish on its own channels rather than the creator's feed. This means follower count is entirely irrelevant; what matters is production quality, on-screen presence, and ability to communicate a product benefit naturally on camera.
Data from archive.com's UGC marketing statistics report shows that 92% of consumers trust peer recommendations over brand messages, and 84% trust brands more when they feature UGC in their marketing. ECommerce sellers have internalized this finding and are investing heavily in UGC video for their product pages, TikTok ads, and Amazon listings. That demand creates a commercial opening for creators who can deliver authentic content at scale, regardless of how many followers they have.
Here is how to position yourself as a UGC creator to eCommerce brands:
Stack Influence's internal campaign data shows that eCommerce brands in the beauty and personal care category reuse micro influencer UGC assets at rates above 60%, significantly higher than the approximately 40% reuse rate seen in general lifestyle categories, making niche-specific content creators disproportionately valuable to brands with targeted ad strategies.
The UGC entry point is particularly strong for creators on Shopify and Amazon seller ecosystems, where brands need a continuous supply of product content for listings, A+ content, and retargeting ads. Explore how influencer seeding works for eCommerce brands to understand how this content pipeline functions from the brand's perspective.
Here is the belief most small creators hold going into 2026 that is holding them back: follower count determines whether a brand will work with you. It is wrong, and the data is unambiguous on this. The metric that determines brand deal access in 2026 is not audience size; it is audience specificity combined with documented engagement quality.
A 2026 analysis of the creator economy by Brandlens found that U.S. creator marketing ad spend is projected to reach nearly $44 billion in 2026, an 18% jump from 2025. That capital is being deployed not through a handful of mega accounts but distributed across a long tail of thousands of niche creators. The structural shift toward niche micro influencers means the supply of brand deal budgets available to small creators has grown proportionally with that overall spend.
What eCommerce sellers actually want from creator partnerships in 2026:
What small creators should do right now: stop filtering your outreach based on a self-assessed follower threshold. Instead, document your engagement rate per post, screenshot comment quality across your last ten posts, and build a one-paragraph audience description that specifies their purchasing behavior. That paragraph is worth more in a pitch deck than any follower number.
Across campaigns managed on the Stack Influence platform, eCommerce brands that activated creators with under 10,000 followers but documented comment-level engagement consistently outperformed campaigns that selected creators based on follower count alone, measured by both UGC reuse rate and downstream conversion tracking.

Every brand deal you land should be treated as a measurable performance event, not just a content deliverable. The Creator ROI Stack is a four-component metric model that helps small creators document their campaign value in language brands understand. Reference the Creator ROI Stack in your post-campaign reports and rate negotiation conversations to demonstrate commercial fluency.
The four components of the Creator ROI Stack are:
Tracking these four metrics gives you a data layer for landing brand sponsorships on Instagram and other platforms that goes beyond surface engagement. For eCommerce sellers evaluating a creator's proposal, the Creator ROI Stack provides a standardized vocabulary that makes comparison across creator pitches much cleaner. Review influencer marketing case studies to see how brands have applied similar performance frameworks in real campaigns.
Before sending a single pitch, run through the Creator Activation Checklist. This secondary framework is a five-point pre-pitch audit that prevents premature outreach and protects your reputation with brands. A checklist-first approach ensures every pitch you send is from a position of readiness, not urgency.
The Creator Activation Checklist:
Run the Creator Activation Checklist before every new brand outreach campaign. Revisit it quarterly as your metrics improve to update your media kit. Brands working with brand ambassadors and running always-on influencer campaigns use similar audit logic internally when vetting creator applications, so aligning your self-assessment with that standard increases your acceptance rate.
Knowing how to get brand deals as a small creator involves knowing where to look, not just how to pitch. Several discovery channels give small creators direct access to brands with active influencer marketing budgets.
Here are the most effective channels for small creators to find active brand deals:
Brands that work with micro influencers at scale use micro influencer agency infrastructure or dedicated platforms to manage creator sourcing. Understanding this infrastructure from the brand's side helps you position your application or pitch to match exactly what their campaign workflow requires.
The question of how to get brand deals as a small creator has a more optimistic answer in 2026 than it did even two years ago. ECommerce brands are structurally shifting budgets toward nano influencers, micro influencers, and UGC creators because the engagement economics favor smaller audiences over large, diffuse ones. The Deal-Seeker Tier Model gives you a sequenced path from content portfolio to paid partnership, and the Creator ROI Stack gives you the commercial language to convert those partnerships into recurring revenue. Start by auditing your current position against the Creator Activation Checklist, build the content library that supports your pitch, and apply through the brand discovery channels where eCommerce sellers are actively looking for creators like you. The budget is there; what brands need now is a creator who can prove their value clearly and consistently.
Most eCommerce sellers hear "TikTok Shop" and picture teenagers buying lip gloss. The reality is that TikTok Shop generated $66 billion in global GMV in 2025 and is projected to surpass $112 billion in 2026, and DTC brands that set up shop early are capturing meaningful revenue before their competitors even log in. If you are running a Shopify store, an Amazon listing, or a consumer brand of any size, understanding how tiktok shop for sellers actually works is no longer optional. This guide walks you through setup, creator strategy, fee structure, and the measurement model you need to operate profitably from day one.
The fastest path to your first sale on TikTok Shop is not a paid ad. It is a pre-recorded creator video seeded with a product sample and a competitive affiliate commission. Before any of that is possible, you need a properly configured seller account with the right infrastructure in place.
Getting the basics right from the start saves weeks of rework. Here is the sequence that works:
According to eMarketer's forecast, TikTok Shop's U.S. ecommerce sales are expected to reach $23.41 billion in 2026, a 48% increase year-over-year, which would give the platform a larger U.S. ecommerce business than Target, Costco, Best Buy, and Kroger combined. That trajectory means every month a seller waits is a month of compound growth they are not capturing. The window for early-mover advantage is narrowing, but it has not closed.
One commonly missed step is building your Shop Performance Score from day one. Settlement timelines for standard sellers run approximately 15 days, while Star Shops receive payouts in 1-8 days , making account health a direct cash flow lever. Respond to customer messages quickly, maintain a low return rate, and fulfill orders within your stated handling window from the first order onward.
TikTok Shop is TikTok's native commerce infrastructure that lets brands and individual sellers list products, accept payments, and fulfill orders entirely within the app. Unlike linking out to a Shopify page or an Amazon listing, TikTok Shop closes the transaction at the exact moment purchase intent peaks, inside the scroll. This architecture is what separates it from every other social commerce attempt in the Western market.
The platform has experienced explosive growth since launching, with the U.S. market alone expanding from roughly 4,450 shops in mid-2023 to over 475,000 shops by mid-2025, a staggering 5,000% increase in just two years. That kind of adoption curve signals a platform shift, not a trend. The seller base includes everything from individual creators running one-product businesses to established DTC brands and Amazon sellers diversifying their channel mix.
The core mechanics sellers need to understand are:
In the U.S., livestreams still account for under 30% of GMV, while pre-recorded creator videos drive about two-thirds of TikTok Shop sales, since viewers prefer on-demand content in their For You feed. This is a critical insight for sellers allocating creative resources: short-form video outperforms live for most product categories, at least in the American market.
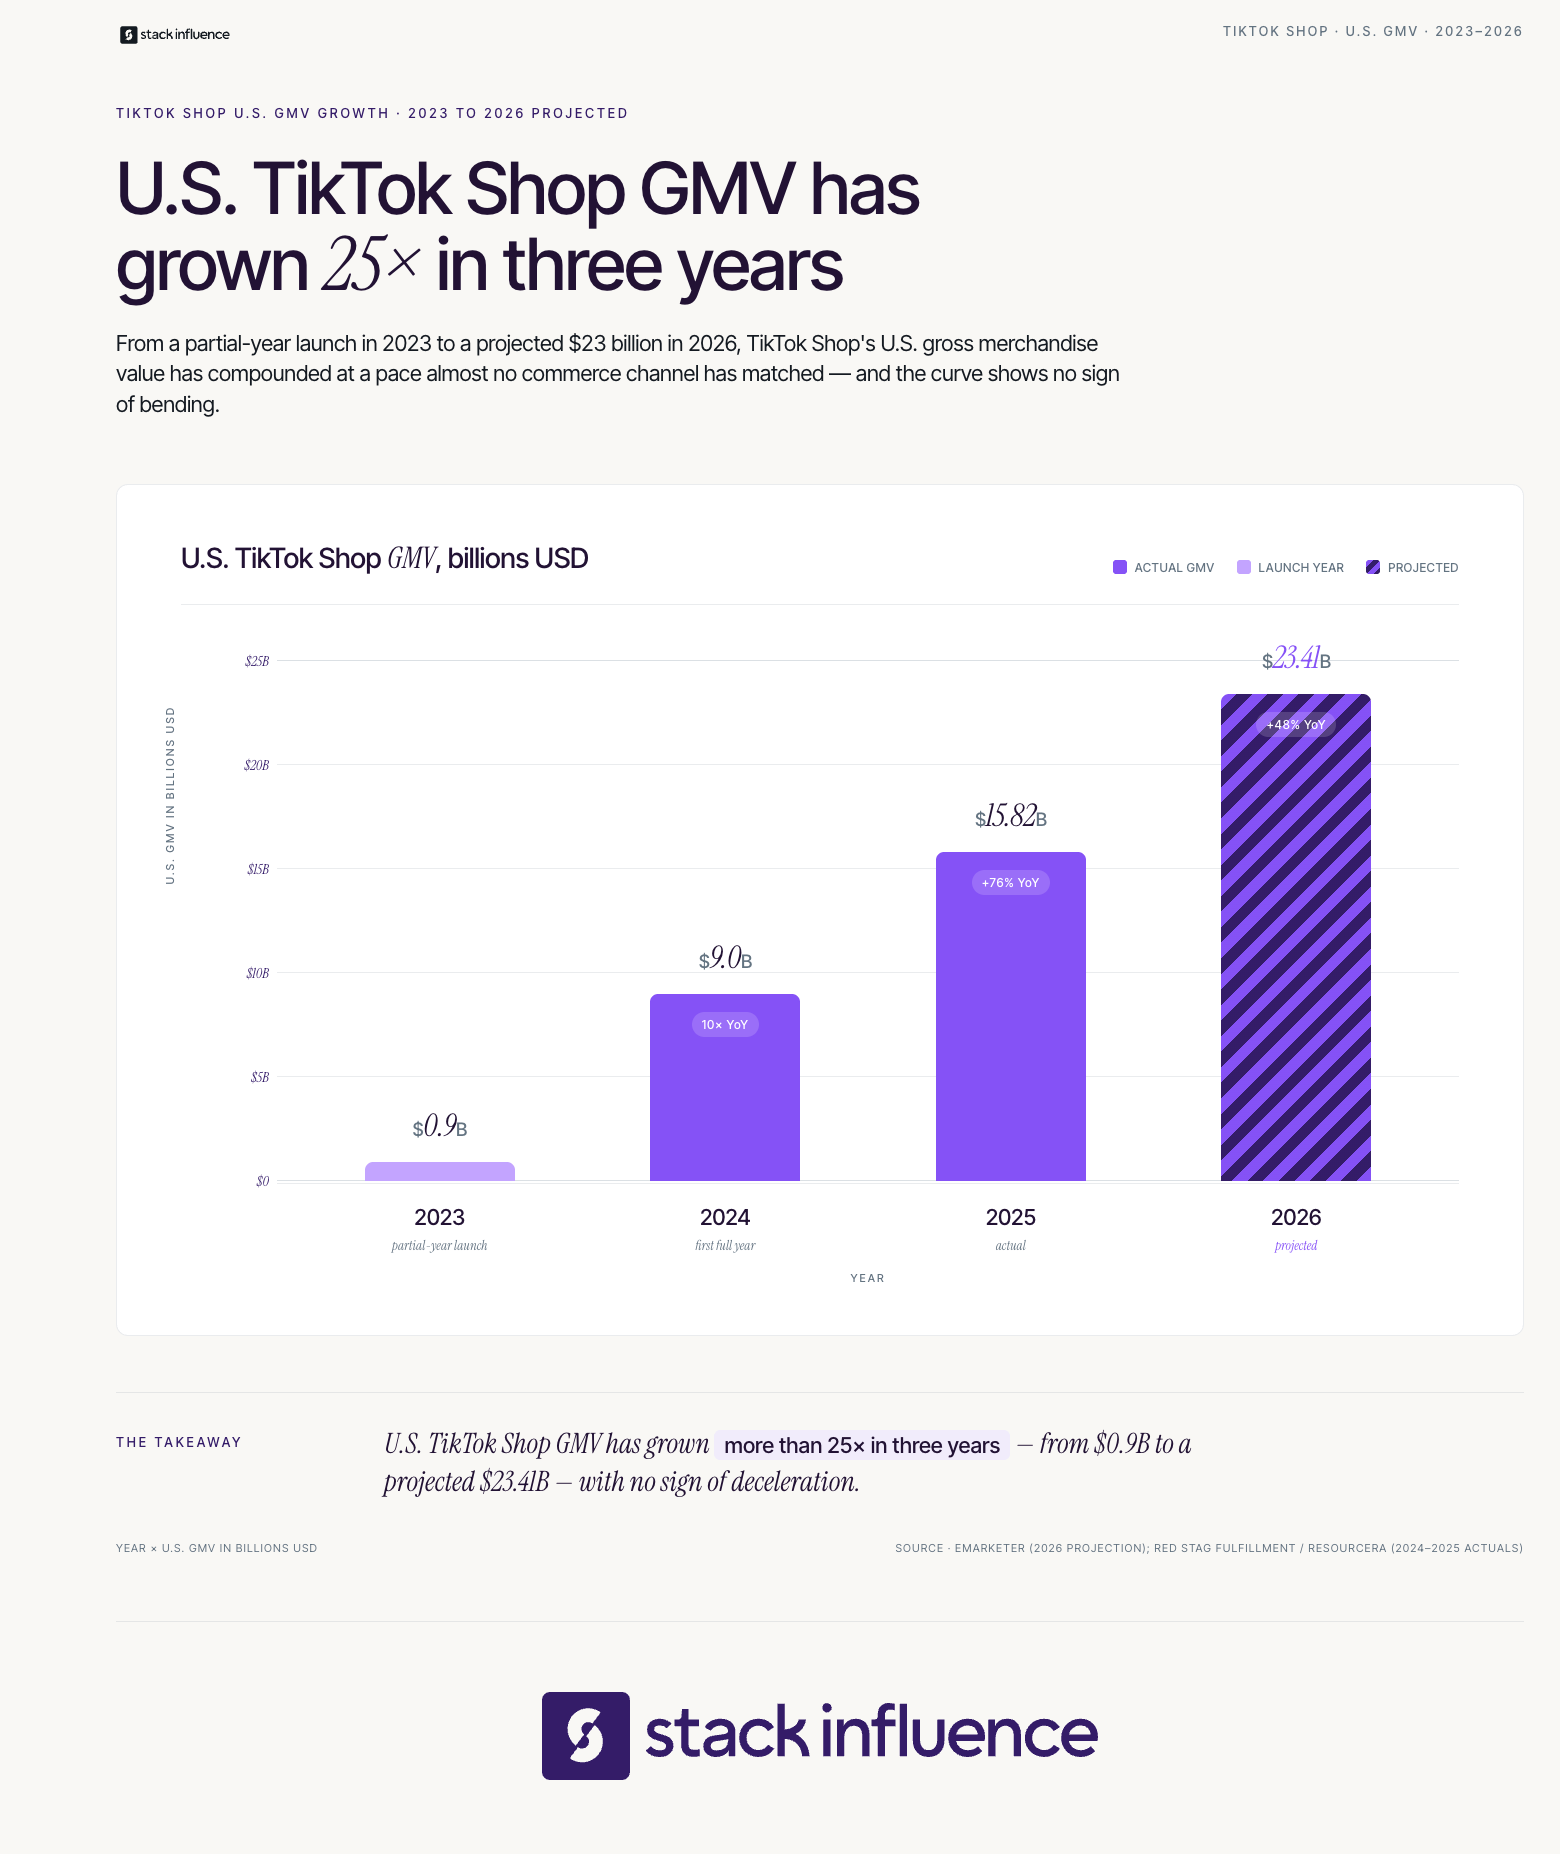
The SCALE framework is a branded acronym designed to help eCommerce sellers audit and prioritize their TikTok Shop setup. Each letter maps to a distinct operational pillar. Use it as a scoring tool during onboarding and again every quarter.
S — Storefront health: Your listing quality, product images, review velocity, and Shop Performance Score. Weak storefront health suppresses organic reach even when creator content performs well.
C — Creator pipeline: The number of active affiliates promoting your products at any given time. A pipeline of 20 to 50 active creators is the minimum threshold for consistent daily GMV. Think of this as a media mix, not a one-off partnership.
A — Affiliate commission strategy: Your commission rates relative to category competitors. TikTok's affiliate marketplace is a competitive marketplace for creator attention. Setting rates too low means your products get skipped.
L — Live commerce cadence: How often your brand or creator partners host shoppable LIVE sessions. Even one weekly LIVE with a strong affiliate can meaningfully lift monthly GMV for impulse-friendly products.
E — Economics per order: Your true cost per sale once referral fees, FBT fees, affiliate commissions, and any ad spend are factored. This number must be modeled before you scale, not after.
TikTok Shop achieves conversion rates of 5-8% for in-app purchases, significantly outperforming traditional ecommerce benchmarks of 2-4%. That conversion premium is the core economic argument for investing in TikTok Shop, but it only translates to profit if your Economics per Order pillar in the SCALE framework is modeled correctly. High conversion rates mean nothing if your margin per unit is negative after the full cost stack.
Stack Influence's internal campaign data shows that eCommerce brands activating all five SCALE pillars within their first 60 days on TikTok Shop see significantly faster GMV ramp than brands that launch with only storefront and a handful of ad posts. Specifically, brands that seed at least 30 creators before their first paid promotion consistently establish a self-reinforcing content loop that sustains organic traffic beyond the seeding period. Building the creator pipeline early is the single highest-leverage action a new seller can take.
Creator partnerships on TikTok Shop operate through a formal affiliate architecture, not the ad-hoc brand deals most sellers are used to from Instagram. Sellers set commission rates at the product level, and creators browse the affiliate marketplace to find products they want to promote. When a creator posts a video or hosts a LIVE with a tagged product and a sale is made, TikTok attributes the sale and pays the commission automatically after a 30-day settlement window.
The TikTok Shop affiliate program is a commission-based partnership model built directly into TikTok's native commerce infrastructure, connecting brand sellers with creator affiliates who promote products through short-form video, LIVE shopping, and product showcase tabs. This infrastructure removes the manual overhead of one-off brand sponsorship deals and creates a self-serve discovery layer where motivated creators come to you.
The two collaboration modes every seller should use together:
According to Capital One Shopping, TikTok affiliate links deliver a 30.1% engagement rate for creators under 50K followers, which is 1,570% higher than comparable rates on Instagram. This is why the creator economy emphasis on smaller creators is not just a trend preference but a data-backed performance signal. Nano influencers and micro influencers routinely outperform macro creators on this platform in terms of engagement per post.
TikTok Shop affiliate commissions are set by sellers, not the platform, which means competitive categories like beauty routinely see 15-20% rates, far above Amazon Associates benchmarks. Sellers entering the beauty or wellness category need to price their commission rates to match or exceed category norms, or their products will simply not appear in active creator prospecting. For context on how influencer seeding pairs with affiliate mechanics, the product seeding workflow for eCommerce brands covers the full sequence in detail.
From Stack Influence's experience running product seeding campaigns for eCommerce brands, sellers who seed 25 or more creators before launching their Open Plan affiliate collaboration consistently generate a higher baseline of organic content views, which in turn improves how the TikTok algorithm surfaces their products to new audiences. The seeded UGC video assets also serve as evergreen proof of product quality that new creator applicants can review before committing to promote.
The most common advice you will find in TikTok Shop guides is to focus on growing your own brand account's follower count before launching. This belief is wrong, and it costs sellers months of misdirected effort. TikTok Shop's algorithm does not reward follower count on seller accounts. It rewards transaction completion. A brand account with 500 followers that has 40 active affiliates posting daily will consistently outperform a brand account with 50,000 followers and no creator pipeline.
TikTok's algorithm does not care about follower count: a seeded creator with 8,000 followers can generate more sales than one with 800,000 if the content resonates. This is structurally different from how Instagram or YouTube favor established audience size. The For You Page is a relevance engine, not a popularity contest, and products that trigger genuine purchase behavior get pushed regardless of brand account size.
Micro-influencers outperform celebrity partnerships on TikTok with an 8.2% average engagement rate compared to 5.3% for macro-influencers, making them a more cost-effective and authentic choice for TikTok campaigns. The implication for sellers is that spreading creator budget across 30 to 50 nano influencers and micro influencers produces more consistent results than concentrating that same budget into one or two large-scale brand sponsorships. Influencer campaigns built on volume of authentic voices beat campaigns built on a single celebrity's reach, every time.
The alternative metric sellers should track instead of brand account follower count is what the CLEAR Metric Stack (detailed in the next section) calls Creator Content Velocity: the number of new affiliate posts containing a tagged product that go live each week. When that number is rising, GMV follows. When it stalls, no amount of paid Shop Ads will substitute for the organic credibility loss.
Influencer marketing platforms that specialize in eCommerce make it practical to run creator partnerships at the volume needed to feed TikTok Shop's algorithm consistently, without managing hundreds of individual brand deals manually. The TikTok-specific solutions page covers how automated product seeding can integrate directly with TikTok Shop's affiliate structure.
Across campaigns managed on the Stack Influence platform, brands that pivot from brand-account-growth tactics to creator-pipeline-growth tactics see a meaningful improvement in weekly GMV within the first four to six weeks. The shift requires accepting that your brand's own TikTok presence matters less than the collective reach of the creator network promoting your products. For most sellers accustomed to owning their content, this is the hardest strategic pivot to make, but the data consistently supports it.
Tracking revenue from TikTok Shop requires a more layered approach than most social commerce reporting. The CLEAR Metric Stack is a named measurement model designed specifically for eCommerce sellers running creator-driven TikTok Shop campaigns. Use it as your primary performance dashboard.
C — Creator Content Velocity: New affiliate posts per week tagging your product. This is your leading indicator. GMV typically lags content velocity by 7-14 days on a healthy shop.
L — Listing Conversion Rate: The percentage of product page views that result in a completed purchase. Benchmark this at 5-8% for in-app checkout and investigate anything below 3% at the listing level.
E — Economics per Order: Your net margin after referral fee, FBT or shipping cost, affiliate commission, and any ad spend. This must be SKU-specific, not blended across the catalog.
A — Affiliate Activation Rate: The percentage of creators who applied to promote your product and actually posted at least one piece of content. A rate below 40% usually signals a brief problem, a pricing mismatch, or a product that does not demonstrate well on video.
R — Return Rate by SKU: Returns above 10% on TikTok Shop trigger platform penalties and suppress listing visibility. Monitor this at the individual product level, not the store level.
When you add transaction fees, shipping costs, affiliate commissions, Shop Ads spend, content production, returns, and chargebacks, the total cost of selling on TikTok Shop can run 35-55% of revenue depending on category and scale. This is why the Economics per Order component of the CLEAR Metric Stack must be calculated before setting prices, not after. Sellers who price based on the advertised 6% referral fee alone routinely discover their margins are negative once the full cost stack is modeled.
Brands have learned that $20 to $50 products outconvert $5 items and $100+ items on TikTok Shop, and that $20 to $50 sweet spot represents 58% of all transactions. This data point feeds directly into the Economics per Order pillar of the SCALE framework. If your current catalog skews above $100 or below $15, a bundling or entry-product strategy can move you into the conversion-optimized price band without a complete SKU overhaul.
The CLEAR Metric Stack also provides the right inputs for running TikTok Spark Ads efficiently. Spark Ads boost existing organic creator content, which means the highest-performing affiliate videos identified through Creator Content Velocity tracking are your best candidates for paid amplification. You are not creating new creative; you are putting spend behind the content that already proved it can convert.

Use the Creator Readiness Checklist as your pre-launch audit. Run through it before activating your first affiliate plan. Reference it again at the 30-day mark to identify gaps before you invest in paid Shop Ads.
TikTok Shop charges sellers a 6% referral fee on most categories, plus a payment processing fee, bringing the true marketplace take-rate to approximately 7% before fulfillment and creator commissions. Understanding this cost baseline is the foundation of the Economics per Order calculation in the SCALE framework. Sellers who skip this step during onboarding are the ones who find themselves unprofitable six weeks into strong GMV growth.
The Creator Readiness Checklist is designed to be run before money is spent, not after. Most sellers who struggle in their first 60 days on TikTok Shop did not have a weak product. They had an incomplete infrastructure. The checklist catches that gap before it costs you anything beyond the initial product seeding budget. For a broader look at how influencer-led campaigns perform across eCommerce categories, the micro influencer and UGC eCommerce resource provides useful benchmark context.
TikTok Shop for sellers in 2026 is one of the most powerful customer acquisition channels available to eCommerce brands willing to invest in a creator pipeline rather than a paid ads dependency. The platform's in-app checkout, performance-based affiliate model, and algorithm that rewards transaction behavior over follower counts make it structurally different from anything that came before it. Apply the SCALE framework to audit your setup, use the CLEAR Metric Stack to track what actually drives profit, and run the Creator Readiness Checklist before spending a single dollar on promotion. The sellers who win on this platform are not the ones with the biggest brand accounts. They are the ones who built the deepest creator networks, fastest.
Most ecommerce sellers chase the same tactics: more ad spend, wider audience targeting, another discount code. The result is predictable — CAC climbs, margins compress, and growth stalls. According to Shopify's global ecommerce sales data, global ecommerce revenue is set to reach $6.88 trillion in 2026, a 7.2% increase from the prior year. The opportunity is real, but the window for low-cost growth has already closed for most DTC brands. After managing thousands of micro influencer campaigns for eCommerce brands across categories, Stack Influence's data shows that sellers who diversify beyond paid ads before scaling see dramatically better unit economics than those who don't.
An ecommerce growth strategy is a coordinated set of decisions about how a brand acquires new customers, retains existing ones, and increases revenue per transaction over time. It is not a single tactic or a seasonal campaign. It is the operating logic that connects your marketing channels, your conversion funnel, and your unit economics into one coherent system.
The defining difference between a growth strategy and a collection of tactics is intentionality. Tactics respond to short-term gaps. A strategy maps the path from where your business is today to where it needs to be in 12 to 24 months, with clear inputs, measurable outputs, and defined decision rules along the way.
For eCommerce sellers operating on Amazon FBA, Shopify, or both, a growth strategy has to address at least three competing pressures: rising paid media costs, platform algorithm changes, and the growing consumer demand for authentic brand experiences. Ignoring any one of these three makes the other two harder to solve.
Here is what a strong ecommerce growth strategy covers:
According to Emplifi's Q3 2025 Social Media Benchmarks report, social media posts featuring user-generated content drove 10.38X higher conversion rates compared to non-UGC posts. That single data point illustrates how much leverage authentic content has over traditional brand creative at the acquisition layer. It also explains why product seeding has moved from a nice-to-have into a core component of modern ecommerce growth strategy for brands that understand their unit economics.
Across campaigns managed on the Stack Influence platform, ecommerce brands that incorporate UGC into their product listings within the first 60 days of launch consistently see stronger add-to-cart rates than brands relying solely on professional photography, particularly in competitive beauty, wellness, and home goods categories.
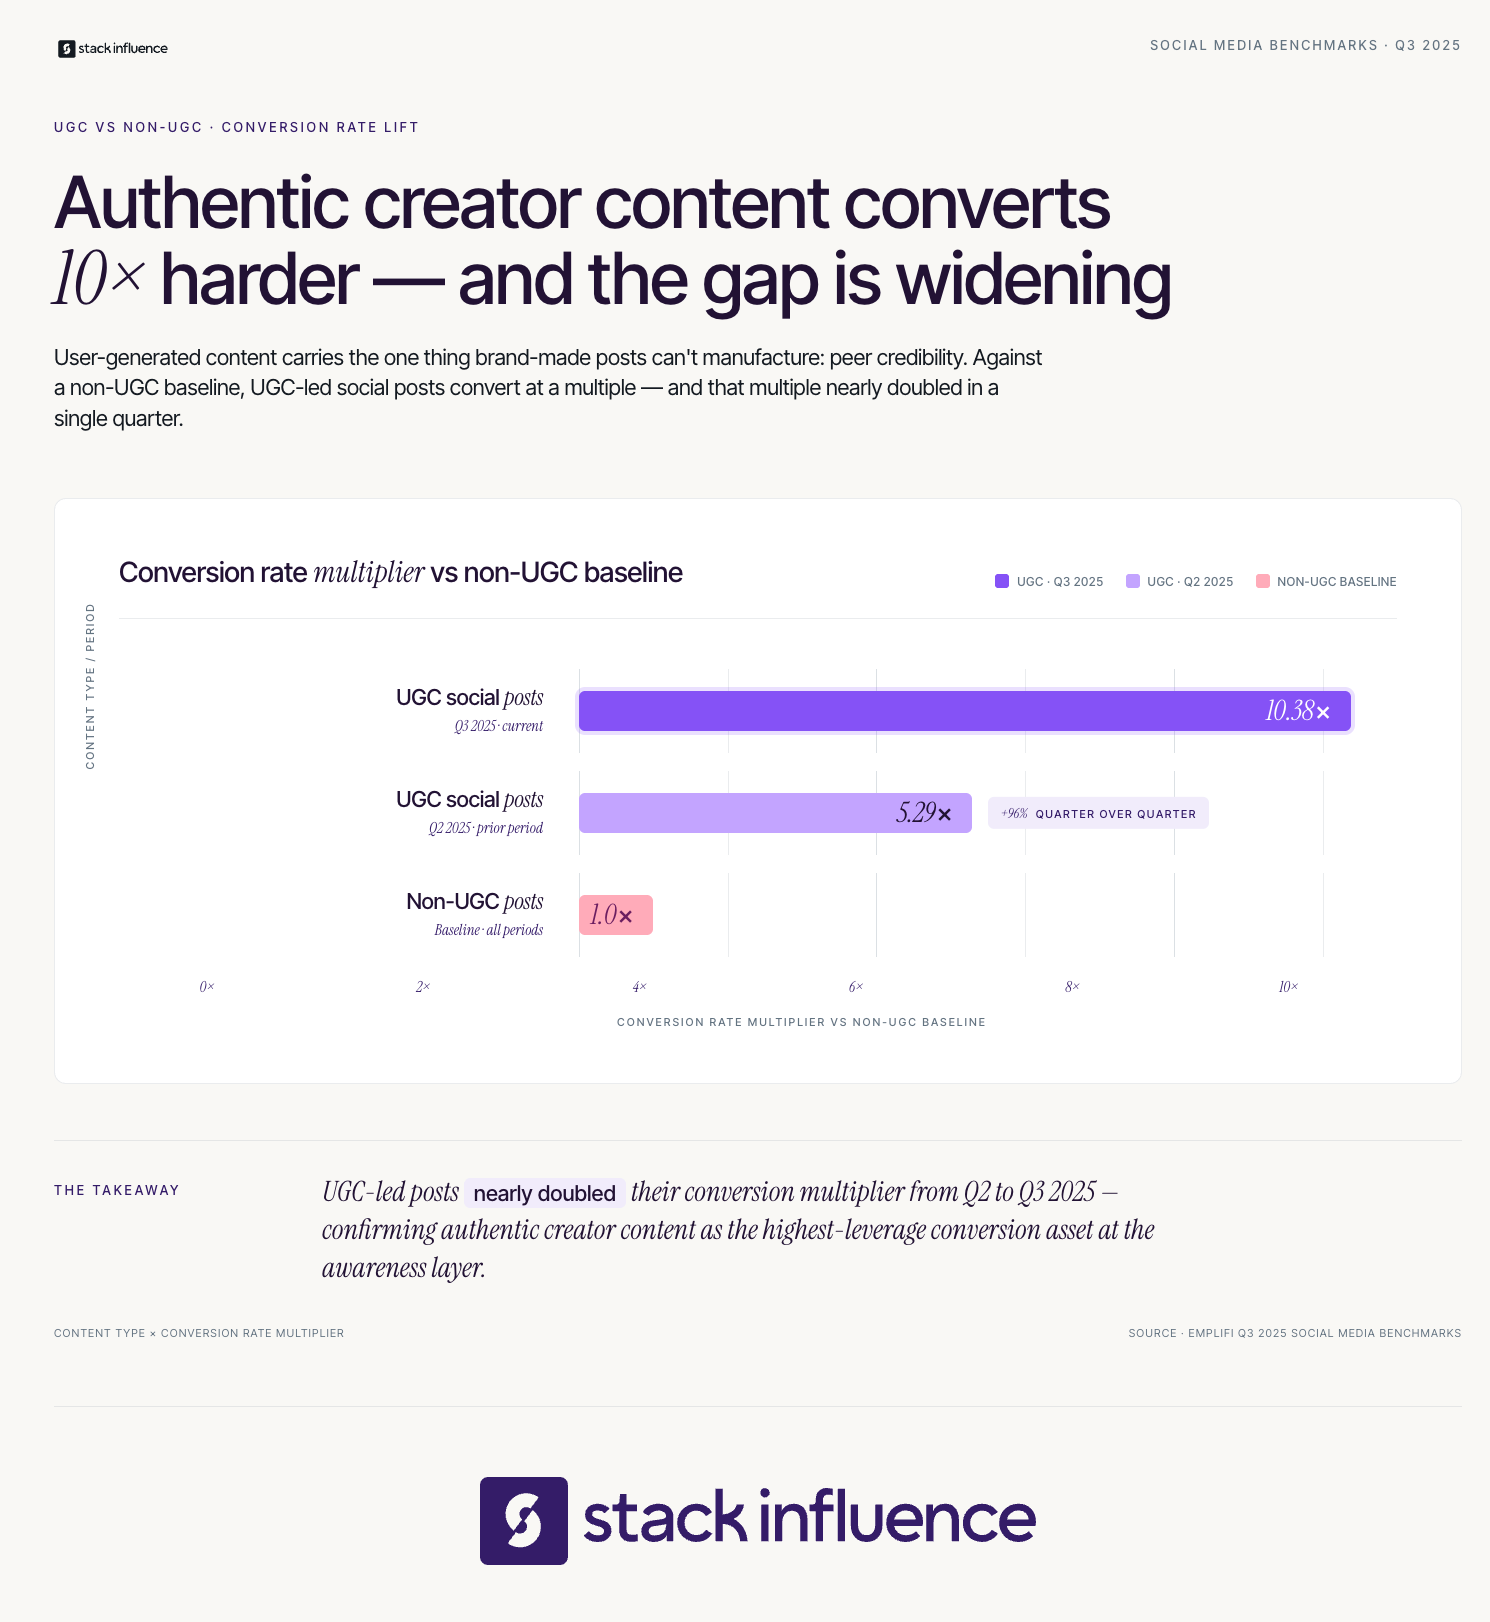
The most common failure mode in ecommerce growth planning is treating all channels and tactics as equal. They are not. Some activities build compounding assets, some produce immediate revenue, and some only work once earlier conditions are met. The SCALE Tiers framework organizes your growth investments into four maturity stages, each with a clear entry condition and a primary output.
The SCALE Tiers are designed to stop sellers from investing in Tier 3 tactics before their Tier 1 foundation is stable. Think of the framework as a growth readiness ladder rather than a menu of options.
Here is how the SCALE Tiers are structured:
According to Mobiloud's 2026 ecommerce CAC benchmark report, influencer-generated content delivers roughly 30% lower cost per acquisition than brand-produced content. For brands in the Tier 2 stage of the SCALE Tiers, this is the clearest argument for making creator-led acquisition a primary channel rather than a supplemental experiment.
According to eMarketer data reported by Captiv8, micro-influencers with 50,000 to 100,000 followers saw conversion rates rise 46% year-over-year to 1.3%, while nano-influencers saw revenues per click jump 74%. These numbers make a strong case for why Tier 2 of the SCALE Tiers should prioritize smaller creator relationships over large influencer partnerships, especially for brands that are not yet at Tier 3 scale.
From Stack Influence's experience running product seeding campaigns for eCommerce brands, the brands that move from Tier 1 to Tier 2 fastest are those that brief their creator partners on specific conversion goals, not just awareness metrics. When creators are aligned on what action the brand wants shoppers to take, the resulting content is more likely to include purchase triggers like direct product comparisons, review-style unboxings, and specific use-case demonstrations that resonate with buyers rather than browsers.
The SCALE Tiers framework is also useful for diagnosing growth plateaus. If a brand is stalled, the answer is almost always found by identifying which tier is underdeveloped, not by simply increasing spend on what already exists. Returning to Tier 1 and reinforcing conversion fundamentals is often more valuable than accelerating Tier 3 ad spend on a leaky funnel.
You can see how this framework connects to influencer seeding workflows for ecommerce and why the sequencing matters for brands at different stages of development. For Amazon sellers specifically, strategies designed for Amazon storefronts follow this same tiered progression from listing readiness to external traffic activation.
This is where most ecommerce growth strategy conversations get honest. Swell's 2026 DTC ecommerce benchmarks show that average ecommerce customer acquisition costs increased 40-60% from 2023 to 2025, now averaging $68 to $84 across categories. For DTC brands, that number is being pushed higher by iOS privacy changes, rising Meta CPMs, and increased competition from well-funded marketplace sellers.
The genuine insight that most growth guides skip past is this: the answer to a rising CAC is not simply to find a cheaper ad platform. The answer is to reduce the number of paid impressions required before a shopper converts, which means improving the quality of trust signals before and at the point of purchase. That is a content and social proof problem more than it is a media buying problem.
Here are the most effective lower-CAC levers for ecommerce sellers in 2026:
Stack Influence's internal campaign data shows that eCommerce brands using product seeding campaigns structured around creator content repurposing reduce their paid social creative production costs by an average of 35 to 45%, compared to brands sourcing all ad creative through traditional production channels. That cost reduction compounds over time as the UGC library grows, giving the brand progressively more creative variety without additional production spend.
For Amazon FBA sellers, the most overlooked piece of the CAC reduction puzzle is the connection between external traffic quality and organic ranking velocity. Bringing high-intent shoppers from creator posts or email campaigns to your Amazon listing does not just generate sales. It signals purchase intent to the A10 algorithm, which rewards conversion velocity with improved organic placement. That improved placement then generates sales without additional paid spend, making the original creator investment self-reinforcing.

Every ecommerce growth strategy needs a named measurement system that connects channel activity to business outcomes. Without it, sellers end up optimizing for vanity metrics, including total impressions, follower counts, and broad ROAS numbers, that feel good but do not explain whether the business is actually growing profitably.
The framework for measurement is called the Revenue Clarity Stack, and it has four defined components that work together to give a complete picture of growth health.
Here are the four components of the Revenue Clarity Stack:
According to Advertise Purple's 2025 guide to the Amazon Brand Referral Bonus, enrolled sellers earn an average 10% bonus on the sales price of products sold through off-Amazon marketing efforts, effectively reducing net referral fees on every attributed sale. For a brand driving $50,000 per month in externally attributed sales, that represents $5,000 in referral fee credits returning to the seller each month.
According to Seller Labs' 2026 external traffic analysis, sellers using external traffic see up to 25% higher conversion rates compared to those relying solely on internal Amazon traffic. When you apply the Revenue Clarity Stack to these numbers, the conclusion is clear: external traffic campaigns that are tracked with Amazon Attribution tags do not just lower CAC. They produce better conversion rates, earn Brand Referral Bonus credits, and improve organic ranking simultaneously.
The Revenue Clarity Stack is also the right lens for evaluating influencer campaigns. Sellers who track revenue per visitor from creator-driven traffic rather than engagement rates make faster optimization decisions. Engagement measures attention; revenue per visitor measures intent. For the purposes of an ecommerce growth strategy, intent is the only metric that feeds the unit economics model.
Apply the Revenue Clarity Stack to your Amazon storefront analytics and attribution setup as the primary measurement layer before layering on platform-specific metrics. You can also integrate this measurement framework with holistic marketing approaches that connect creator activity to downstream conversion data.
Before adding a new channel or scaling an existing one, the Growth Readiness Checklist gives sellers a fast diagnostic to confirm whether the foundational conditions for profitable growth are actually in place. This secondary framework is designed to be run every quarter, or any time a growth initiative is underperforming expectations.
The Growth Readiness Checklist has seven items, each serving as an independent gate. A "no" on any item is a signal to address that condition before investing further in the channel above it.
Here is the Growth Readiness Checklist:
The Growth Readiness Checklist works alongside the SCALE Tiers framework to give sellers both a maturity roadmap and an operational gate. The SCALE Tiers tell you where to go next. The Growth Readiness Checklist tells you whether you are actually ready to go there. Used together, they prevent the most common growth mistake in ecommerce: scaling a channel before the foundation beneath it is solid.
For brands that are newer to creator-led acquisition, reviewing how micro influencer campaigns work at the platform level and checking influencer marketing case studies from comparable brands can accelerate the checklist process by showing what good looks like before committing significant budget. Many sellers also find it useful to review 2026 influencer marketing predictions to ensure their Growth Readiness Checklist includes channels that will still be worth investing in 12 months from now.
Data from Stack Influence's micro influencer campaigns suggests that brands with a complete UGC content library of at least ten pieces of reusable creator content before launching paid amplification see 2 to 3 times the click-to-purchase rate on their paid social ads compared to brands launching paid campaigns with only brand-produced creative. The library is the leverage. Building it through product seeding before scaling paid is the sequencing decision that separates efficient growers from expensive ones.
An ecommerce growth strategy is not something you set once and revisit annually. It is a living system that requires quarterly recalibration as CAC shifts, platforms evolve, and consumer trust preferences change. The five pillars covered here, including clear strategic framing, the SCALE Tiers framework, low-CAC acquisition through creator content, measurement via the Revenue Clarity Stack, and pre-scaling diagnostics through the Growth Readiness Checklist, give eCommerce sellers a structured way to grow without burning budget on an unstable foundation.
The brands that will win in 2026 and beyond are not necessarily the ones with the largest ad budgets. They are the ones that build compounding assets including creator content, email lists, authentic reviews, and attribution clarity, and then invest paid dollars on top of an already-converting system. Start with the SCALE Tiers to locate where you are in your growth journey. Then run the Growth Readiness Checklist before you write the next media check.
Sustainable ecommerce growth strategy requires patience with the foundation and boldness with the scale. The sequence matters as much as the investment.
Short-form video has fundamentally restructured how Instagram distributes content, and Reels sit at the center of that shift. Instagram and Facebook Reels are played more than 200 billion times every day combined, according to figures Mark Zuckerberg cited on Meta's Q3 2025 earnings call, a number that doubled from approximately 100 billion daily plays a year earlier. That growth rate tells every content creator one critical thing: Instagram is actively betting its platform future on Reels, which means it is actively rewarding creators who master the format. If your Instagram growth strategy still centers on static posts, you are operating with the wrong playbook entirely.
Among all content types on Instagram, Reels achieve the highest reach rate, outperforming static images, carousels, and standard video posts, largely because Instagram's algorithm pushes Reels beyond a brand's existing followers and exposes content to a wider audience. For nano influencers and micro influencers trying to grow without a paid acquisition budget, that organic reach advantage is essentially a free distribution engine. This guide gives you a structured, research-backed instagram reels strategy built around frameworks you can deploy this week.
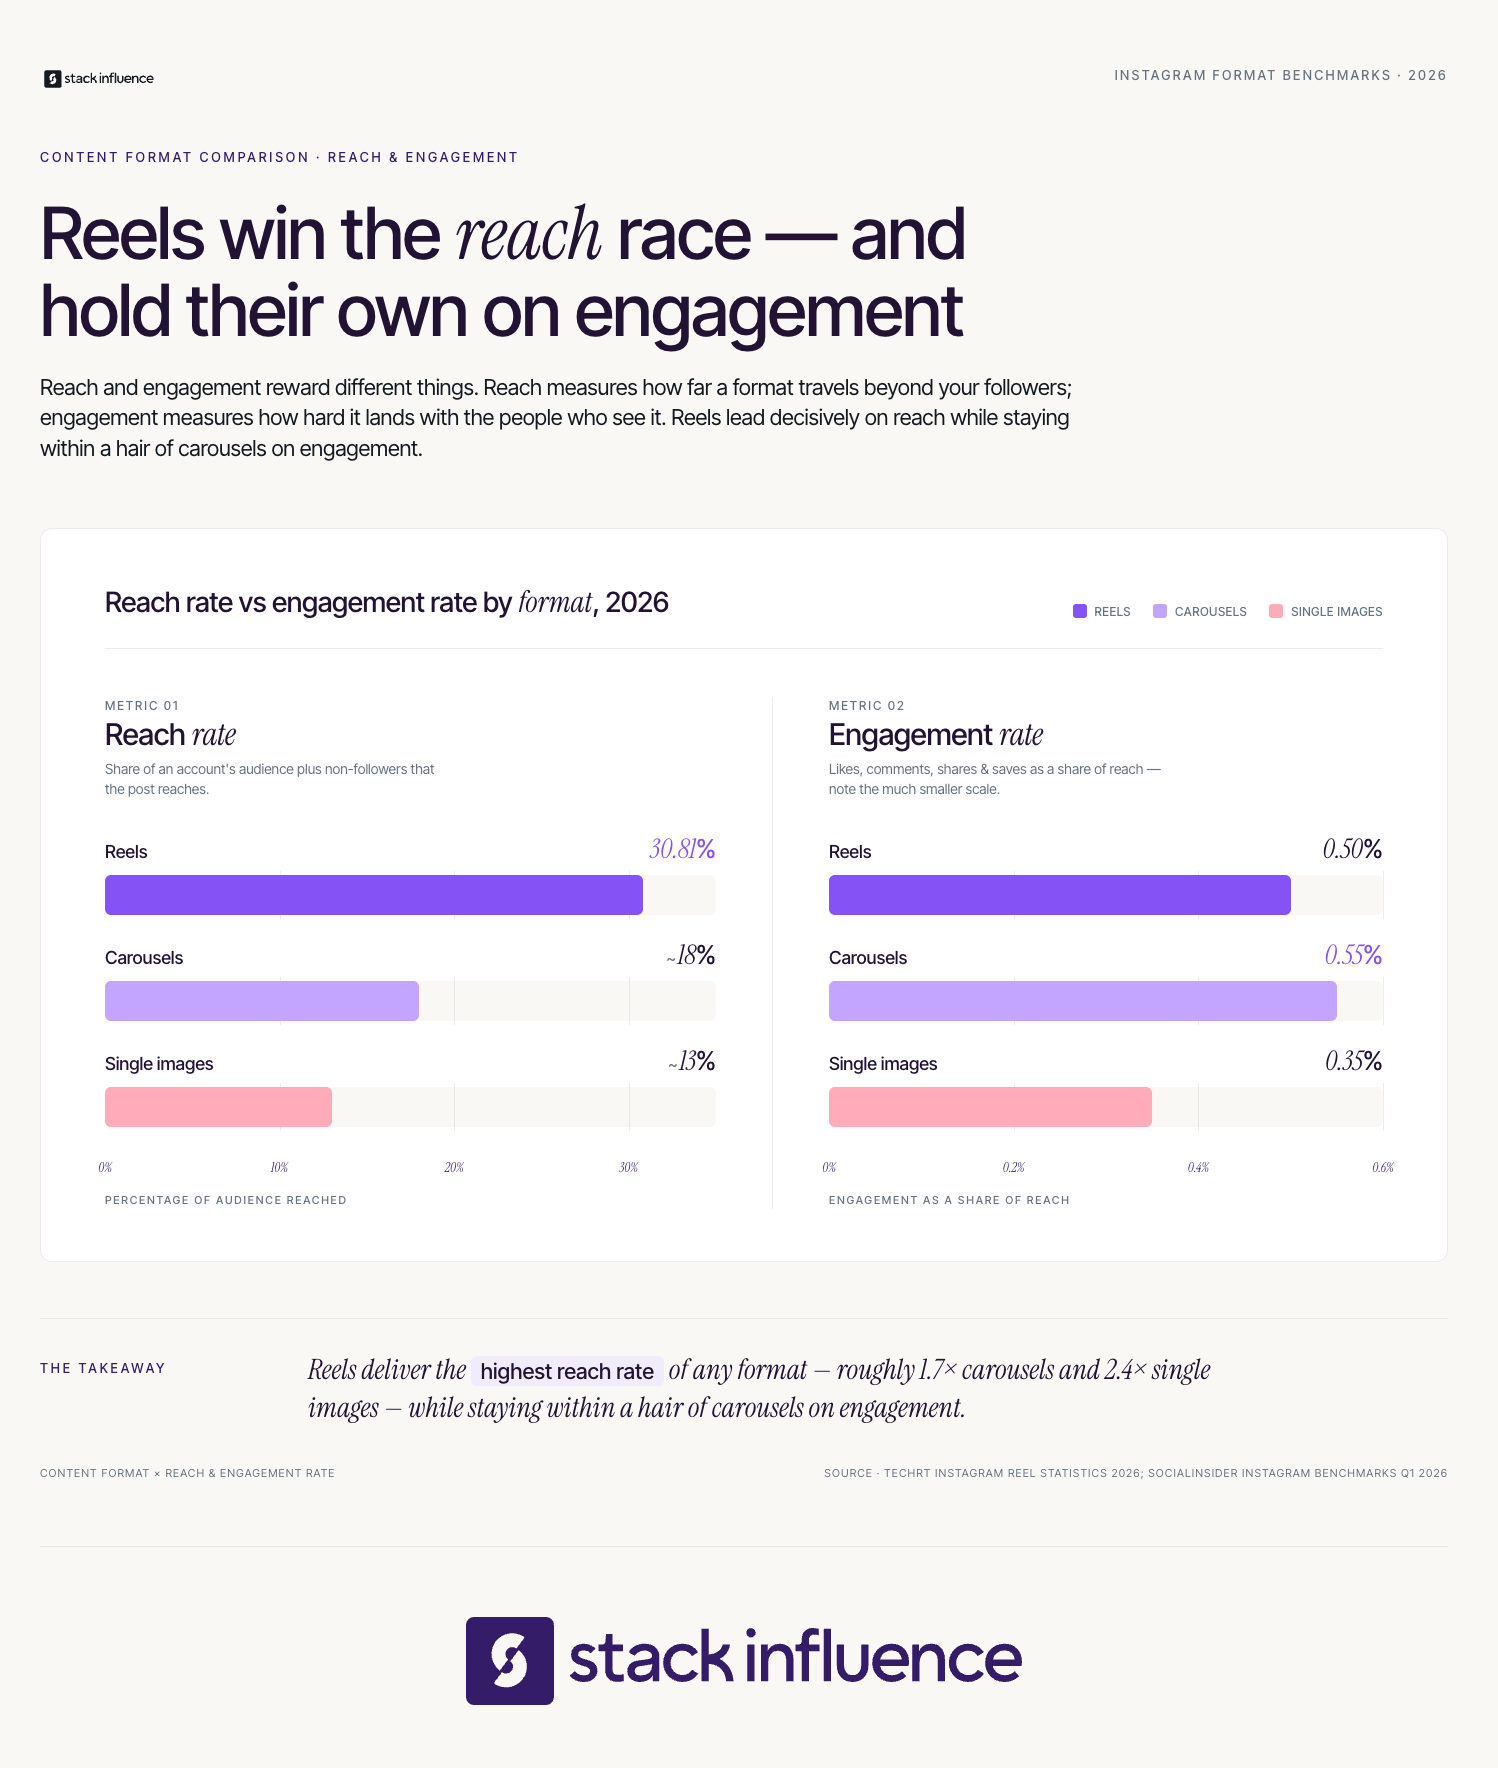
An Instagram Reels strategy is a documented, repeatable system for planning, producing, publishing, and measuring short-form video content on Instagram to achieve a specific growth or monetization outcome. The word "strategy" is doing real work here — it separates intentional creators from those who post whenever inspiration strikes and wonder why their reach plateaus. According to Sprout Social's 2026 Social Media Content Strategy Report, 60% of consumers interact with brand content on Instagram at least multiple times a week. That audience behavior creates a repeating opportunity window that only a consistent strategy can fully capture.
Sprout Social's report also confirms that over a quarter of social users from every generation turn to Instagram to find their next purchase. For UGC creators and influencers pursuing brand partnerships, that purchase intent context matters enormously. Brands looking for influencers are not just paying for eyeballs — they are paying for an audience that is primed to act. A Reels strategy that builds that kind of audience is a direct path to better brand sponsorship offers and more sustainable creator income.
Here is what a functional Instagram Reels strategy must include:
Without all five of these components working together, you have content production — not strategy.
Understanding the ranking engine is the prerequisite to any effective instagram reels strategy. The three most important signals confirmed by Instagram head Adam Mosseri are watch time, sends per reach (DM shares), and likes per reach. Most creators optimize for the third signal while systematically ignoring the first two, which is why their content underperforms even when it looks polished.
Watch time is the number one ranking factor, confirmed by Adam Mosseri in January 2025, meaning how long people watch your Reels matters more than likes or shares for initial distribution, while secondary factors vary by reach type: likes per reach matters more for existing followers, while DM shares matter more for reaching new audiences. That nuance is significant. A Reel that gets lots of likes from your current followers will perform differently than one that gets lots of DM sends from strangers, and each outcome serves a different growth goal.
Keyword-rich captions now outperform hashtag-heavy strategies as Instagram shifts toward SEO and interest-based recommendations. Creators still stuffing fifteen hashtags into every caption are wasting effort that could go toward writing a caption that matches search intent. The algorithm categorizes your content based on what you say, not just what you tag.
Stack Influence's internal campaign data shows that micro influencer Reels briefed with a clear hook direction and a single conversion prompt in the caption consistently outperform unstructured Reels on DM send rates by a meaningful margin, suggesting that caption structure is as important as visual quality for the algorithm signals that drive non-follower reach.
Here are the core ranking signals and what they mean for your production decisions:
Instagram's 2026 Reels algorithm prioritizes shares, watch time, and originality, and Reels go through a cold-start testing phase where early watch time and engagement determine whether Instagram expands distribution. That cold-start window — typically the first hour after posting — is when your publishing timing and initial audience engagement matter most. Post when your core followers are active so early likes and DM sends give the algorithm enough signal to push the Reel wider.
The REEL Sequence is the primary framework in this guide, and it is designed to give every piece of content a repeatable production logic from concept to post. Each of the five steps maps to a specific algorithm signal or audience behavior, so nothing in your production workflow is arbitrary. Reference the REEL Sequence whenever you are planning a new batch of content and use it to audit underperforming Reels.
The five steps are:
The REEL Sequence should be applied at the scripting stage, not the editing stage. Waiting until post-production to think about your retention hook or engagement trigger means you are retrofitting strategy onto footage rather than building it in from the start. Creators who run the REEL Sequence before filming consistently produce content with stronger early watch-time metrics.
Here is how to apply the REEL Sequence to a single piece of content in practice:
Trial Reels represent one of the most underused tools in any instagram reels strategy, and most creators still do not have a system for using them deliberately. Instagram introduced Trial Reels as a way to try out content and see what performs best, by giving creators the option to share Reels with people who do not follow them, specifically for creators who want to experiment with new ideas without the worry of how their followers might react.
According to Instagram's own data, 40% of creators who try Trial Reels go on to post more Reels overall, and 80% of those see increased reach with non-followers. That is a compelling argument for building Trial Reels into a weekly content rotation rather than treating them as an occasional curiosity. The practical workflow is simple: test new hooks, formats, or niche-adjacent topics as Trial Reels, then only publish to your main profile the ones that perform.
According to Instagram's own creator blog, Trial Reels are shown to non-followers first, giving creators a risk-free way to test new genres, storytelling formats, or topics before their existing audience ever sees the content. For creators building a niche micro influencer brand, this is a way to test content pivots without damaging the trust you have built with your existing community.
Use Trial Reels strategically with this approach:
Here is where the instagram reels strategy becomes a direct business lever for smaller creators. Instagram micro-influencers generate an average engagement rate of 3.86%, compared to just 1.21% for mega-influencers. That gap is not a coincidence — it reflects the audience relationship that micro influencers and nano influencers build through consistent, niche-specific content. A Reels strategy that compounds that relationship over time is what turns a creator account into a business.
Micro-influencers with 10,000 to 100,000 followers deliver 60% higher engagement rates than those with over 1 million followers at roughly one-tenth the cost per post, and their audiences are more niche, more trusting, and far more likely to act on recommendations. Brands running influencer campaigns increasingly understand this math, which is why product seeding campaigns and ambassador programs now prioritize smaller creators over celebrity placements.
From Stack Influence's experience running micro influencer Reels campaigns across multiple ecommerce verticals, creators who maintain a consistent content pillar structure on Reels attract brand partnership inquiries at a meaningfully higher rate than accounts that post varied content without a clear niche, because brand sponsorship teams evaluate account consistency before they evaluate follower count.
Here is what a Reels-driven creator monetization stack looks like for micro and nano creators:
The creator economy reward structure increasingly favors creators who show up consistently in a defined niche, and Reels are the fastest format for compounding that authority. An account with 8,000 followers and a three-month track record of high-watch-time Reels in a specific category will attract better brand deal offers than a 50,000-follower account posting inconsistently across five topics.
Most creators measure Reels performance with the wrong metrics. Follower count, total views, and raw likes are visibility metrics, not performance metrics. The Signal Stack is a four-component measurement model built around the signals the algorithm actually uses to distribute content, giving you a dashboard that is aligned with how Instagram works.
The four components of the Signal Stack are:
Across campaigns managed on the Stack Influence platform, micro influencer creators who track all four Signal Stack components and use them to iterate on content structure see faster improvement in non-follower reach than those optimizing for views or likes alone, because views and likes do not directly predict how the algorithm distributes future content.
Apply the Signal Stack after every Reel publish, not just on your top performers. Patterns become visible at around 10 to 15 posts, and those patterns tell you whether your hook structure, content length, or topic choice is creating friction before the key distribution signals fire.

Here is the genuinely novel angle that most Instagram Reels strategy guides avoid: consistency is a more dangerous trap than inconsistency for creators in 2026. The conventional advice is to post more, post often, and never break the streak. But that framing misses the mechanism.
December 2025 updates crushed aggregator accounts with a 60 to 80% reach drop while rewarding original creators with 40 to 60% increases. The algorithm is not rewarding posting frequency — it is rewarding originality and niche coherence. A creator who posts seven Reels a week using recycled formats and trending audio is being actively penalized by the same system they think they are gaming.
Posting ten or more times weekly often leads to diminishing returns and creator burnout. The ceiling on useful posting frequency is much lower than most productivity-focused creator advice suggests. The practical alternative to the consistency trap is what this guide calls the "Intentional Cadence" principle: a smaller number of Reels produced with full REEL Sequence attention beats a higher volume of rushed, algorithmically incoherent posts every single time.
Here is the Intentional Cadence approach in practice:
The influencer marketing platform landscape rewards creators who build a tight, recognizable niche. Brands using influencer marketing agencies to run creator activation campaigns are specifically looking for account coherence, not just follower count. An instagram reels strategy built on intentional cadence rather than volume gives you a better profile for brand deals and a healthier relationship with the content creation process.
A Reels strategy that does not connect to income is a hobby, not a business. The bridge between great content and brand sponsorship is a documented track record of the Signal Stack metrics described earlier. Brands looking for influencers want to see watch rate, save rate, and sends per reach — not just a vanity follower count.
Short-form video, specifically TikToks and Instagram Reels, accounts for 87% of content brands request from micro-influencers. That stat tells you exactly what your content portfolio should look like when you are approaching a brand or applying to an influencer marketing platform. If your portfolio does not lead with Reels, you are not speaking the language brands are buying.
Data from Stack Influence's micro influencer campaigns suggests that creators who include Signal Stack metrics in their media kit — specifically watch rate and sends per reach — close brand sponsorship negotiations faster than those presenting only follower count and reach, because Signal Stack metrics speak directly to the distribution quality brands are actually paying for.
Here is how to build a Reels-based media kit that performs for UGC platforms and brand partnerships:
The creator economy is increasingly structured around long-term brand ambassador relationships rather than one-off sponsored posts. In 2026, Instagram's algorithm increasingly rewards authentic, native content over polished brand posts. Creators who build a Reels strategy anchored in genuine niche authority are exactly what brands are looking for when they think about sustainable influencer campaigns.
The sequence matters. Creators who develop a deliberate instagram reels strategy first — one built around the REEL Sequence, anchored by the Signal Stack, and protected from the consistency trap — grow audiences that are more engaged, more monetizable, and more attractive to brand partners. Reels are not a feature; they are the primary distribution engine of the platform. Treat them accordingly. Start with the REEL Sequence on your next three pieces of content, measure every output against the Signal Stack, and let Trial Reels absorb your experiments. The creators winning in 2026 are not the ones posting the most — they are the ones posting with the most intention.
Email is not dead. It is simply less forgiving.
For eCommerce sellers, ecommerce email marketing now sits at the center of retention, marketplace traffic, product launches, and customer lifetime value. The brands winning with email in 2026 are not sending more blasts. They are building smarter owned-audience systems that turn subscribers into repeat buyers, Amazon shoppers, reviewers, and advocates.
eCommerce email marketing is the use of email campaigns and automated flows to turn shoppers, subscribers, and past buyers into repeat customers. It includes welcome flows, abandoned cart emails, browse abandonment messages, product education, review requests, replenishment reminders, win-back campaigns, and launch announcements.
The channel matters because it gives sellers a direct line to customers they do not fully control on marketplaces or social platforms. Unlike paid ads, where costs rise with every click, email lets brands communicate with an owned audience after the initial opt-in. That does not make email free, but it does make it more durable than channels controlled by algorithms.
Strong eCommerce email programs usually include these components:
The performance gap between basic newsletters and automated lifecycle email is large. Omnisend’s 2026 email benchmark analysis found that automated emails generated $3.41 per email sent in 2025, compared with $0.155 for scheduled campaign emails. That makes automation the first major upgrade for sellers who still rely on broad batch sends.
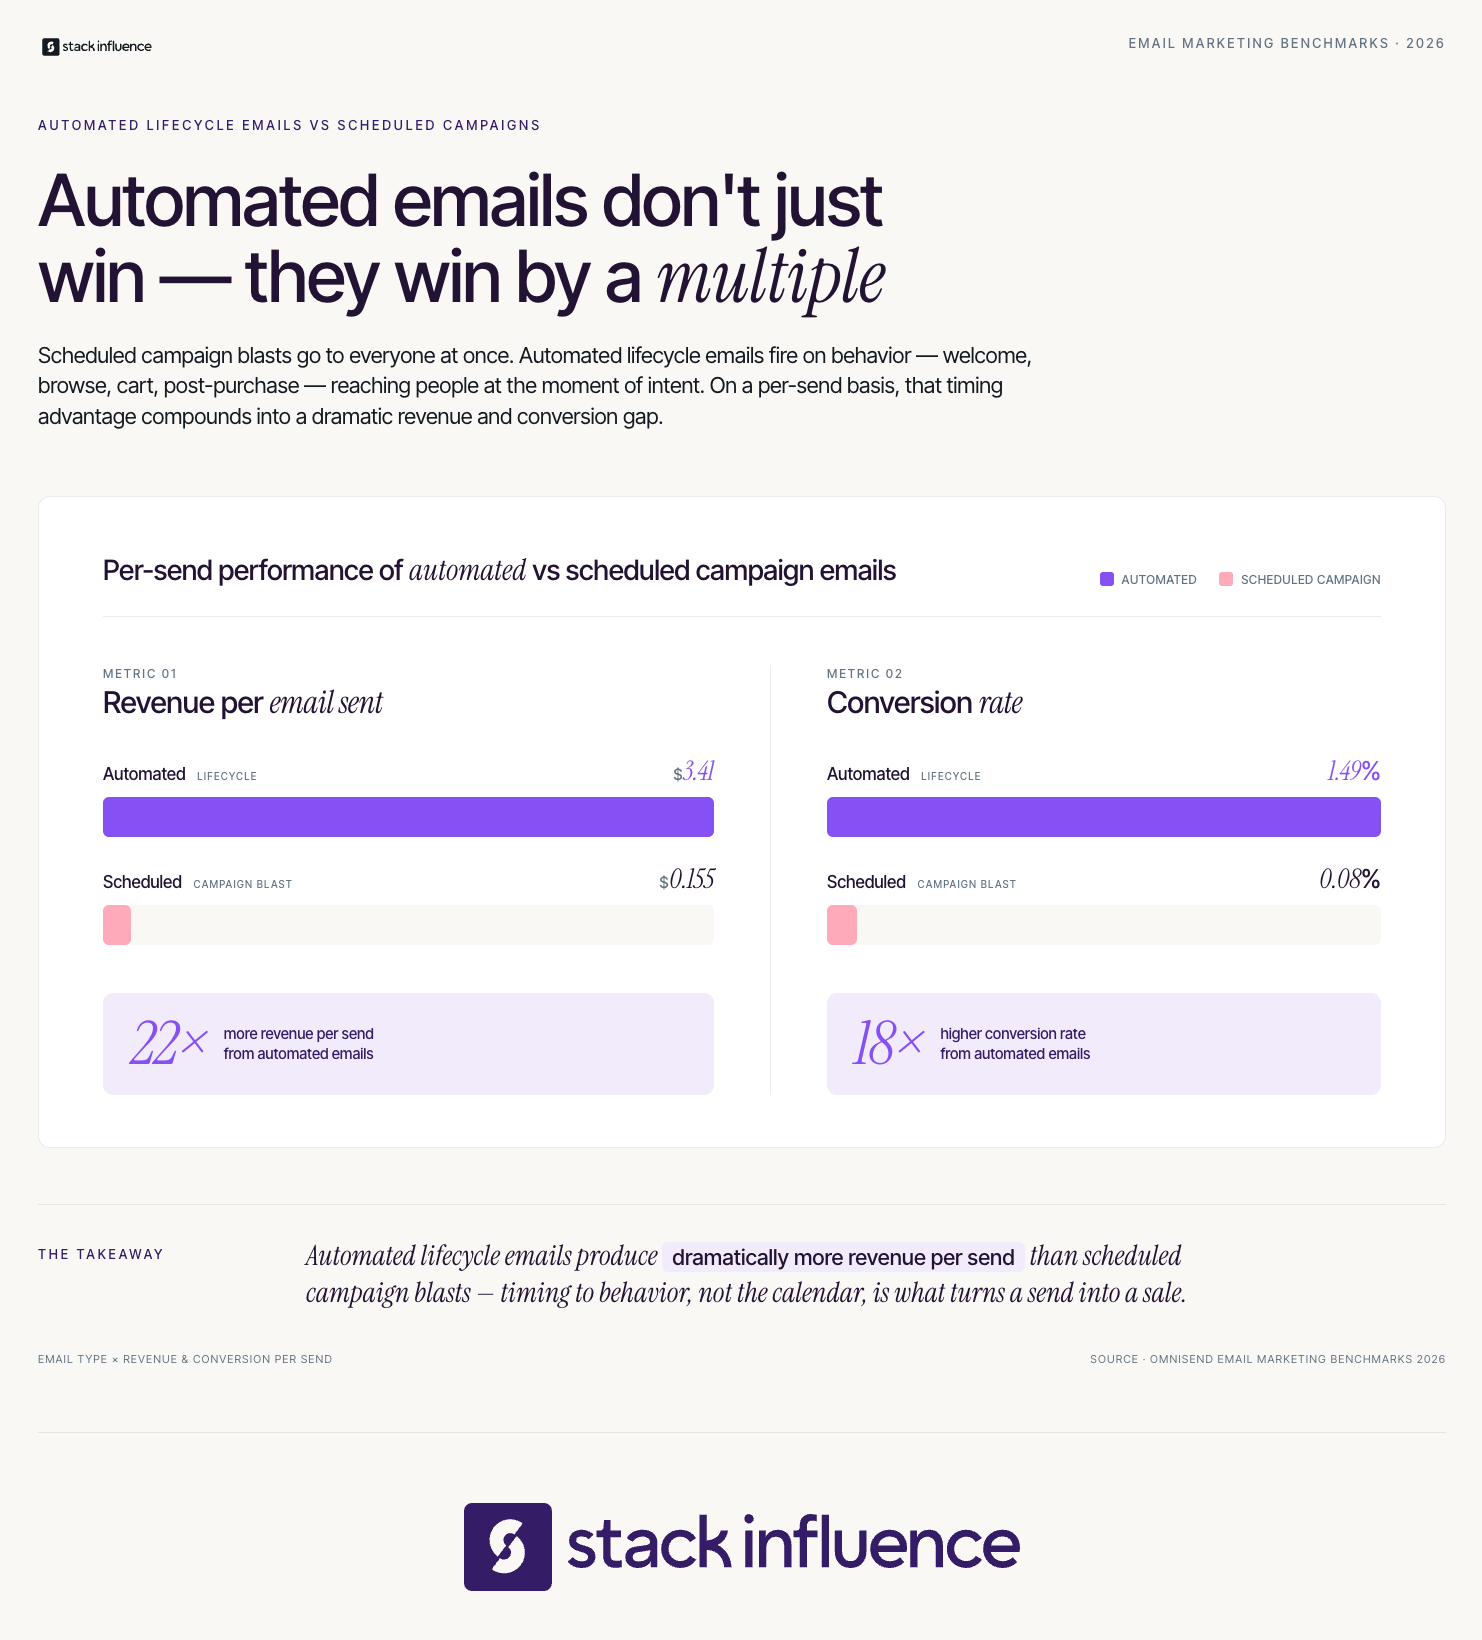
Email remains profitable because it converts demand that sellers already paid to create. A shopper may discover a product through Meta, TikTok, Google, Amazon, or an influencer post, but email gives the brand another chance to educate, reassure, and recover the sale.
That is why email should not be treated as a backup channel. It is a conversion layer that sits underneath paid media, influencer marketing, Amazon storefront strategy, and DTC retention. Litmus research on email ROI reports that email drives an average return of $36 for every dollar spent, while its 2025 State of Email data shows 35% of companies see email ROI of 36:1 or more.
The most profitable email programs usually focus on three jobs:
Email also gets stronger when it borrows proof from other channels. An email featuring a creator tutorial, customer photo, or product-use video often feels more believable than studio-only creative. That is why Stack Influence sellers often pair user-generated content with email flows instead of saving creator assets only for social posts.
The Email Revenue Ladder is a four-tier model for turning email from a newsletter channel into a revenue system. Each tier builds on the one before it, so sellers should not jump into advanced personalization before the basics work.
Tier 1 is Capture. At this stage, the goal is to collect qualified subscribers from your Shopify store, Amazon packaging, creator traffic, and post-purchase moments. A seller using Shopify influencer marketing solutions should send creator traffic to a landing page that captures emails before asking for a purchase.
Tier 2 is Convert. This tier uses automated flows to turn intent into revenue. Welcome emails, abandoned cart reminders, browse abandonment flows, and product education sequences should be active before sellers scale paid or creator-driven traffic.
Tier 3 is Compound. This tier uses segmentation and repeat-purchase logic to grow LTV. Segments can include first-time buyers, VIP customers, Amazon buyers, category-specific shoppers, subscribers who clicked UGC, and customers due for replenishment.
Tier 4 is Connect. This is where email works with Amazon Attribution, Brand Referral Bonus tracking, influencer content, review generation, and paid retargeting. Sellers using Amazon influencer marketing solutions can connect creator discovery, email follow-up, and Amazon storefront traffic into one coordinated system.
The Email Revenue Ladder gives sellers a simple diagnostic. If revenue is weak, the question is not “Should we send more emails?” The better question is which tier is broken.
Amazon sellers should use email as an external traffic and education channel, not as a shortcut around marketplace trust rules. The best use case is sending subscribers to Amazon when the shopper prefers Prime checkout, when a launch needs sales velocity, or when a storefront needs external traffic.
The challenge is that Amazon does not behave like a DTC checkout. Sellers cannot see every customer-level detail they would see on Shopify, and they must avoid any messaging that improperly incentivizes reviews. That means the email strategy has to be structured around compliant education, traffic, and tracking.
Amazon sellers should build emails around these workflows:
Amazon’s own Amazon Attribution page describes the tool as a free measurement solution for non-Amazon channels, including email, social, video, and influencer campaigns. For eligible brand owners, the Brand Referral Bonus program credits brands an average of 10% of sales from traffic they drive to Amazon.
This is where email becomes more than retention. A properly tagged campaign can lower effective acquisition cost, support external traffic goals, and help sellers understand whether email subscribers prefer Amazon checkout or DTC checkout.
Product seeding can make email more persuasive because it gives sellers authentic content before asking subscribers to buy. Instead of announcing a product with only polished brand creative, sellers can use creator photos, use-case clips, and short testimonials that show the product in real life.
Stack Influence’s internal campaign data shows that brands repurposing creator assets into launch emails within 14 days of receiving content often see 20% to 35% higher click engagement than similar emails relying only on studio product photography. That pattern aligns with broader shopper behavior, since Bazaarvoice’s Shopper Experience Index research found that 65% of global shoppers rely on UGC, including ratings, reviews, photos, and videos, in buying decisions.
A product seeding to email workflow can look like this:
From Stack Influence’s experience running product seeding campaigns, the strongest email results usually come when the creator brief leaves room for natural product use. Over-scripted content may look controlled, but it often performs worse because subscribers can sense when the proof feels staged.
Attribution breaks down when sellers judge email only by what the email platform can see. A Shopify purchase may appear clearly in Klaviyo, Mailchimp, or another ESP, but an Amazon purchase requires separate tracking through Amazon Attribution.
The Clean Revenue Stack is a three-layer measurement model for eCommerce sellers running email across DTC and Amazon. It separates what happened in the inbox, what happened after the click, and what happened later in the customer lifecycle.
The Clean Revenue Stack includes:
This stack matters because open rate is not a revenue strategy. Klaviyo’s 2026 email benchmark data reports an average automated email flow click rate of 5.58% across industries, with the top 10% reaching 10.48%. The gap between average and top-performing flows usually comes from better segmentation, stronger offer timing, and more relevant creative.
Across campaigns managed on the Stack Influence platform, Amazon sellers that create unique Attribution links before launching creator-driven email campaigns typically see cleaner reporting and recover roughly 8% to 12% of attributed Amazon revenue through Brand Referral Bonus credits when eligible. Sellers can then compare email traffic against influencer traffic using the same measurement logic, which makes budget decisions less subjective.
For deeper Amazon measurement planning, Stack Influence’s guide to return on ad spend for eCommerce sellers and its breakdown of how to rank on Amazon can support the reporting side of the Clean Revenue Stack.

The fastest way to weaken ecommerce email marketing is to train subscribers to wait for coupons. Discounts can work, but they become expensive when every campaign teaches customers that the listed price is temporary.
The better approach is to treat email as a decision-support channel. A subscriber may need proof, education, timing, comparison, replenishment logic, or creator validation before they need a lower price. This is especially important for Amazon FBA brands that already face marketplace fee pressure and cannot afford to buy every conversion with margin.
Discount-first email creates three problems:
Personalization makes this shift more important. McKinsey’s personalization research notes that 71% of consumers expect personalized interactions, while 76% get frustrated when companies fail to deliver them. That means sellers should use customer behavior to decide what someone needs next, not send the same coupon to everyone.
A better campaign might send education to new subscribers, replenishment reminders to past buyers, creator proof to hesitant clickers, and early access to VIP customers. Sellers using ambassador and affiliate programs can also feature long-term creator partners in retention emails, which makes the message feel less like a promotion and more like a recommendation.
The Inbox-Ready Checklist is a secondary decision tool for sellers planning a campaign before launch. It helps teams catch the mistakes that usually hurt deliverability, clicks, and conversion.
Use the Inbox-Ready Checklist before every major send:
The checklist is simple, but it prevents costly errors. Many sellers write the email first and ask about tracking after the campaign is already live. That reverses the order. The destination, segment, offer, and attribution plan should shape the email before creative starts.
This is also where marketing and operations need to work together. If an email campaign sends subscribers to Amazon but the ASIN is low on inventory, the sales spike can create stockout risk. If the email sends traffic to Shopify but the product page lacks creator proof, the campaign may create clicks without conversions. The best email programs connect creative, inventory, margin, and measurement before launch.
eCommerce email marketing is no longer just a newsletter function. For modern sellers, it is a profit system that connects retention, creator content, Amazon storefront traffic, DTC conversion, and long-term customer value.
The sellers who win in 2026 will not be the ones sending the most emails. They will be the ones using the Email Revenue Ladder to capture better subscribers, convert them with automated flows, compound repeat purchases, and connect email to Amazon Attribution, UGC, and influencer-driven demand. Build the system once, improve it every month, and email becomes one of the few growth channels that gets more valuable as your customer base grows.
Most eCommerce sellers spend the majority of their budget trying to reach strangers with paid ads, while consistently underinvesting in the channel that closes the deal. According to McKinsey research, word of mouth marketing is the primary factor behind 20% to 50% of all purchasing decisions. That stat should reorder your priorities. This guide breaks down a structured system for engineering word of mouth at scale, why creator partnerships are the most efficient lever available to eCommerce brands today, and how to measure the impact before and after your next campaign.
Word of mouth marketing (WOMM) is the practice of intentionally creating conditions that cause customers, creators, and community members to recommend your product to others. It is distinct from paid advertising because the message is delivered by a third party, not the brand itself. That distinction is what makes it work.
WiserReview's analysis of consumer trust data shows that 92% of people trust word of mouth referrals more than any other form of advertising. No amount of creative budget can replicate the credibility that comes from someone with no financial reason to lie telling another person that a product changed their life. For eCommerce sellers, where customers cannot touch or test a product before buying, this trust transfer is the mechanism behind conversion.
In the digital era, WOMM takes several distinct forms that eCommerce sellers need to manage as a system:
RevenueMemo's 2026 analysis confirms that word of mouth drives $6 trillion in annual global consumer spending, accounting for roughly 13% of all purchases worldwide. The opportunity is enormous, and most eCommerce brands are still treating it as a secondary channel rather than a primary growth driver.
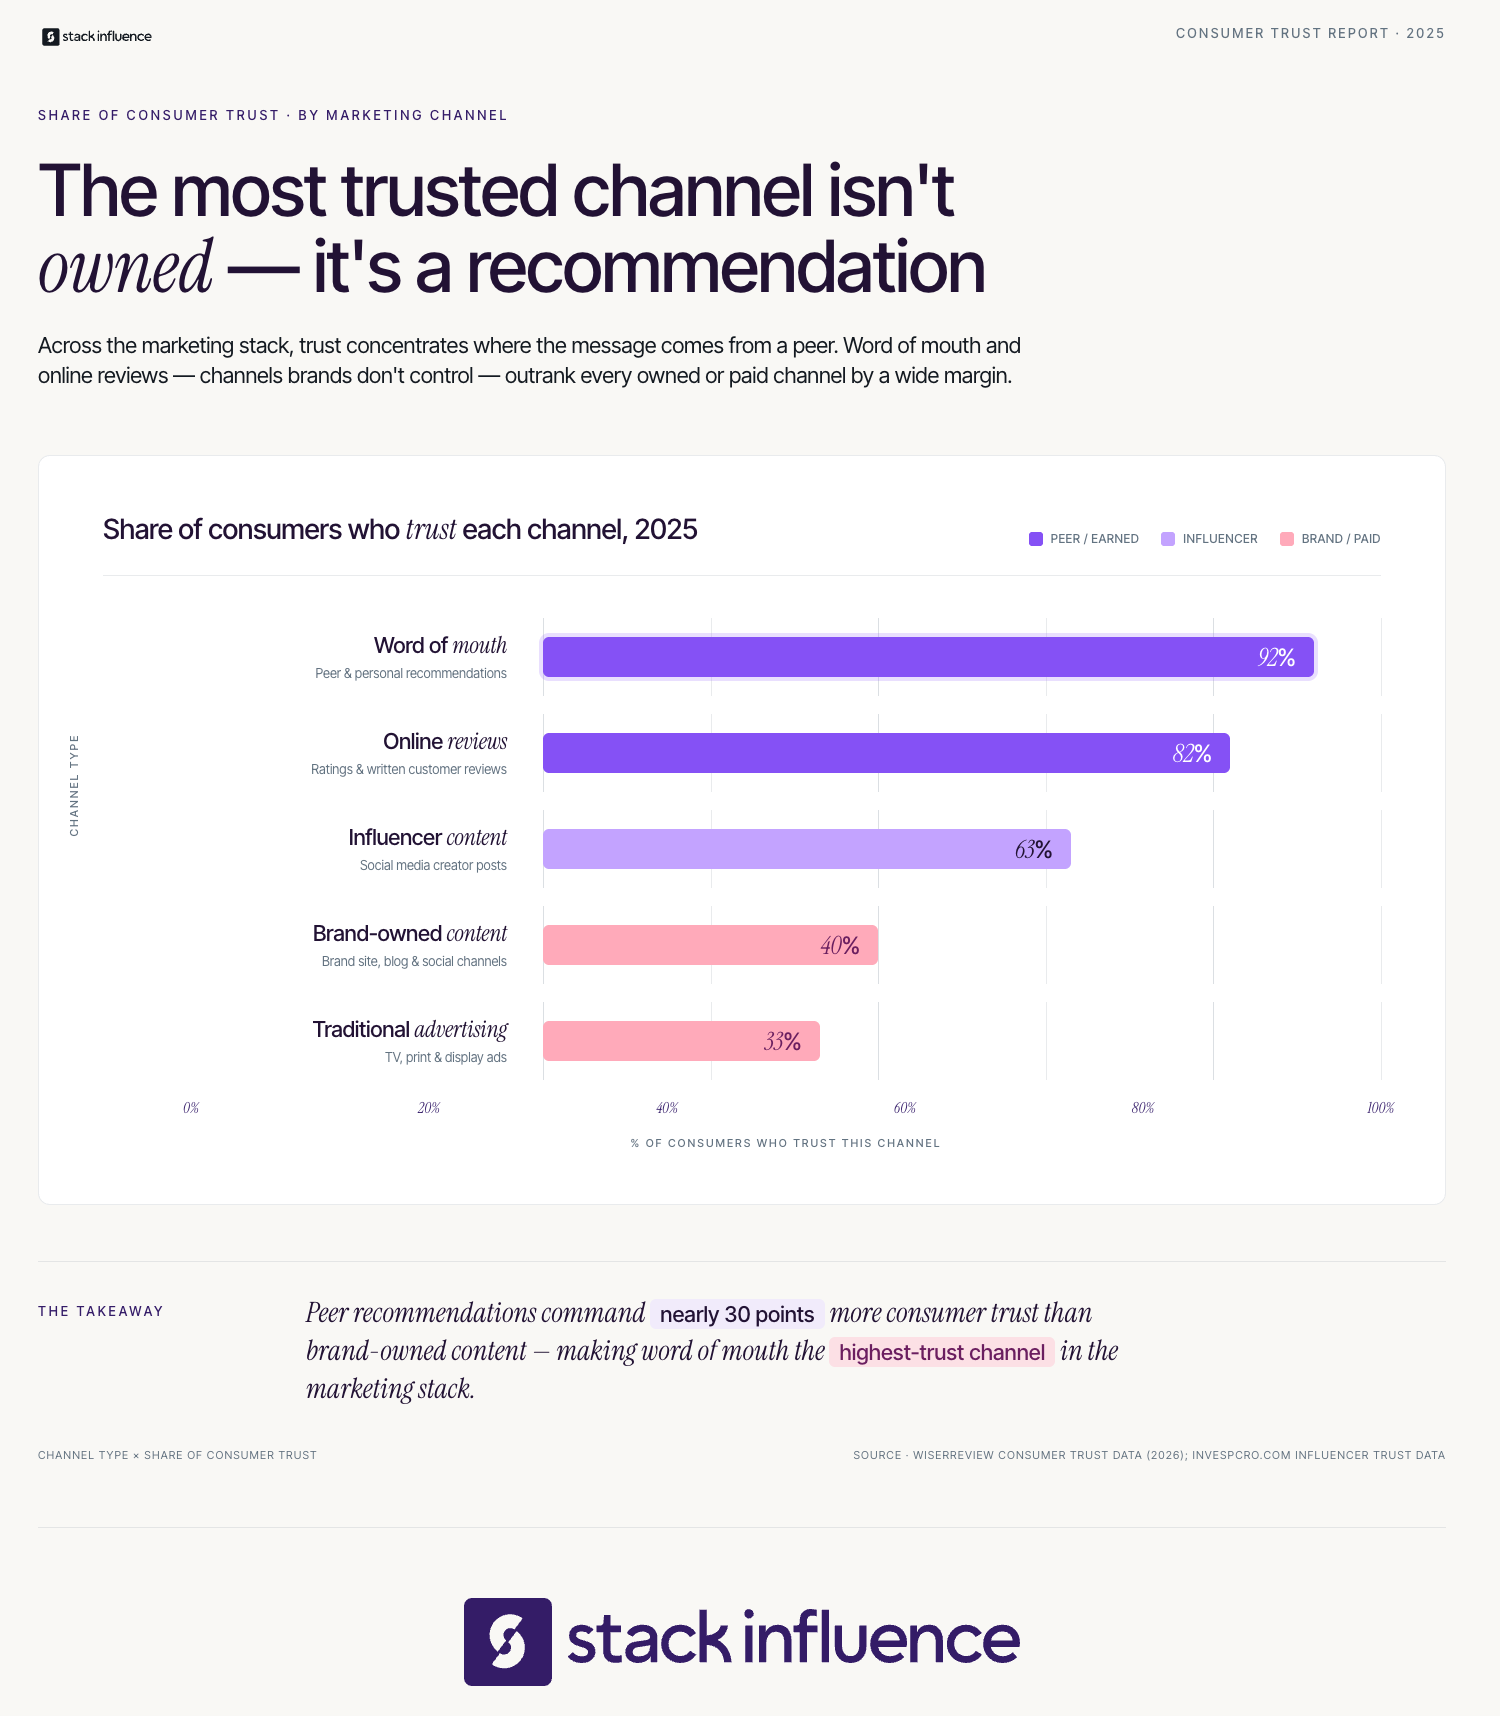
The most common failure mode in eCommerce word of mouth strategy is treating it as a single tactic. Brands either run one influencer campaign and call it done, or they wait passively for organic reviews to accumulate. Neither approach compounds. The WORD Signal System is a four-stage framework for engineering sustained peer advocacy.
The WORD Signal System stages work in sequence, but each stage also reinforces the others when operating simultaneously. Brands that operate all four stages at once generate the compounding effect that separates breakout DTC brands from those stuck in paid-ad dependency cycles. You can explore how product seeding workflows fuel word of mouth for eCommerce brands as a practical entry point for Stage 2.
The four stages are:
Data from Stack Influence's micro influencer campaigns suggests that eCommerce brands running structured product seeding programs across 50 or more creators per month see content output that is 3 to 4 times greater per dollar spent than brands running a small number of high-fee macro-influencer partnerships, with reuse rates on the resulting UGC video consistently above 55%.
The WORD Signal System is not a one-time campaign architecture. It is an ongoing operating model. Each stage feeds the next, and the output of Stage R directly funds the efficiency of Stage D.
The intuitive assumption is that a bigger audience creates more word of mouth. The data inverts that assumption entirely. Reach and resonance are not the same variable, and for eCommerce sellers trying to drive purchase decisions, resonance is what closes the sale.
According to Later's 2025 Influencer Marketing Report cited by Dataslayer, 73% of brands now prefer micro and mid-tier influencers who offer stronger engagement-to-cost ratios. That preference is backed by numbers. Micro-influencers deliver engagement rates of 6.15% to 6.76%, compared to 1% to 2% for larger accounts, and the median cost-per-thousand for micro-influencer content is less than half that of macro-level campaigns. This is why niche micro influencer partnerships have become the preferred strategy for brands that want peer-level trust without celebrity-level pricing.
The Glossier playbook offers a real-world proof point. According to Roe Magazine's case study, Glossier was valued at $1.8 billion by 2019, built largely on a micro-influencer strategy and community word of mouth. They activated small creators, everyday fans, and niche bloggers rather than investing in celebrity endorsements. The result was trust at scale, not just reach.
For eCommerce sellers, the WORD Signal System's Stage O benefits specifically from nano influencers for the following reasons:
Across campaigns managed on the Stack Influence platform, brands in competitive categories like beauty and personal care see micro influencer UGC reuse rates above 60% when content briefs are kept conversational and product demonstrations are unscripted, compared to roughly 35% for campaigns that over-brief creators with rigid talking points.

Stage R of the WORD Signal System depends on a healthy pipeline of UGC to function. The logic is straightforward. Creator content and customer reviews are peer voices captured in reusable format. When deployed on product pages, in paid ads, or in email flows, they extend word of mouth beyond the original audience and into every touchpoint in the purchase journey.
The conversion data on UGC is difficult to argue with. Yotpo's analysis of 200,000 stores found that shoppers who interact with UGC on a product page convert at a rate 161% higher than those who do not see any peer content. That lift is not marginal. It represents a fundamental change in purchase likelihood driven entirely by social proof. Brands looking for a practical entry point into this ecosystem can explore UGC platform options for eCommerce to understand the infrastructure required to capture and syndicate creator content at scale.
The most valuable formats within Stage R include:
Bazaarvoice's research on UGC behavior shows that UGC-based ads generate 4 times higher click-through rates than average, and 84% of consumers are more likely to trust a brand's marketing campaign when it features user-generated content. The implication for eCommerce sellers is clear: the most cost-efficient ad creative is content your customers and creators already made.
The most persistent myth about word of mouth marketing is that it cannot be measured. It can, and for eCommerce sellers with the right tracking infrastructure, it can be measured with more precision than most brand-awareness campaigns. The WORD Attribution Model covers the four measurement layers that matter.
The WORD Attribution Model layers are:
For Amazon sellers, the measurement infrastructure has a built-in financial bonus. According to PartnerBoost's analysis of the program, when a shopper clicks through an Amazon Attribution link and purchases a branded SKU, the seller earns a bonus credit averaging around 10% that offsets future referral fees. That means every creator-driven sale tracked through Amazon Attribution becomes incrementally cheaper to fulfill at the marketplace level.
The operational sequence for Amazon sellers combining the WORD Signal System with Amazon's tracking tools is:
According to Advertise Purple's Brand Referral Bonus breakdown, rates vary significantly from 5% in Electronics to 45% for Amazon Device Accessories, meaning Amazon sellers should prioritize product seeding in high-bonus categories to maximize the financial return from influencer-driven traffic. For Shopify sellers running parallel campaigns, the same UTM and discount code infrastructure feeds directly into Google Analytics, enabling cross-platform attribution across the full WORD Signal System. Explore Shopify influencer marketing options to understand how to connect creator campaigns directly to storefront conversion data.
The conventional approach to word of mouth marketing starts from the wrong end of the funnel. Most guides tell brands to "identify brand advocates" and "encourage reviews." That framing treats word of mouth as a passive harvest rather than an active infrastructure problem. The result is a strategy that depends entirely on already-satisfied customers doing the work for free.
There are three structural errors that make most word of mouth programs underperform:
BigCommerce's 2025 survey data found that 63% of small and medium-sized businesses credit WOMM for increasing their customer base, but most of those businesses were taking a passive approach. The upside for brands that move from passive to active is substantial: forms.app's analysis citing Forbes shows that word of mouth inspired purchases generate over twice as much revenue as paid advertising, with a 37% higher customer retention rate.
The strategic implication is that word of mouth marketing should be treated as infrastructure, not as a campaign. The brands winning on this channel are not running occasional influencer activations. They are running persistent, scalable micro influencer promotions with documented activation playbooks, structured UGC pipelines, and attribution systems that close the loop between creator content and converted revenue. Brands looking for context on how this works in practice can review influencer marketing case studies that document how peer advocacy translates into measurable eCommerce outcomes.
Word of mouth marketing is not a soft channel reserved for brands with viral products and lucky moments. It is an engineered system that compounds when structured correctly and deteriorates when treated as an afterthought. For eCommerce sellers competing in crowded categories, the WORD Signal System provides the operational architecture to move from passive advocacy to active, measurable, compounding peer influence. Activate the right creators, recycle their content into every conversion touchpoint, measure attribution down to the SKU level, and let peer trust do what paid ads cannot. The brands that build this infrastructure in 2026 will own the acquisition economics that define the next phase of eCommerce growth.