




Your competitors leave a visible trail across social media: the topics they repeat, the formats they favor, the creators they partner with, the ads they keep running, the questions customers ask, and the offers they push. Most teams collect this information without turning it into a decision.
A useful social media competitor analysis gives ecommerce brands, social media managers, and content teams a disciplined way to interpret that trail. The goal is to identify meaningful signals, reject distorted ones, and choose what deserves a controlled test on your own channels.
From Stack Influence’s campaign work, the most useful competitive reviews connect creative activity with creator participation, audience response, and commerce outcomes. This guide shows how to build that kind of system.
Key Takeaways
- Compare systems, not isolated posts: Evaluate content pillars, formats, creator activity, paid support, and conversion paths over a consistent time window.
- Normalize every metric: Engagement rates, views, follower growth, and search interest are only comparable when the denominator, platform, account size, and date range are clear.
- Separate observation from inference: Public data can show what happened, but it rarely proves why it happened or whether a competitor generated profitable results.
- Turn findings into experiments: Every useful insight should lead to a hypothesis, test, success metric, and next decision.
- Include creator and commerce signals: UGC, micro-influencer partnerships, product seeding, paid amplification, and marketplace movement may explain performance that a basic profile audit misses.
What Is Social Media Competitor Analysis?
Social media competitor analysis is the structured process of comparing how selected brands earn attention, engage audiences, use paid and creator content, and move people toward a business outcome. A useful analysis normalizes time periods and metrics, separates observation from inference, and converts findings into testable decisions for your own channels.
A one-time audit produces a snapshot, while a recurring system reveals durable patterns. Competitor analysis should also extend beyond direct rivals to adjacent brands and accounts competing for the same audience attention.
Start with what social media analytics measures for ecommerce teams, then add a relevant external benchmark. Rival IQ’s 2025 benchmark report covers 2,100 brands across 14 industries, illustrating why industry context matters more than a universal “good engagement rate.”
The Competitive Signal Loop
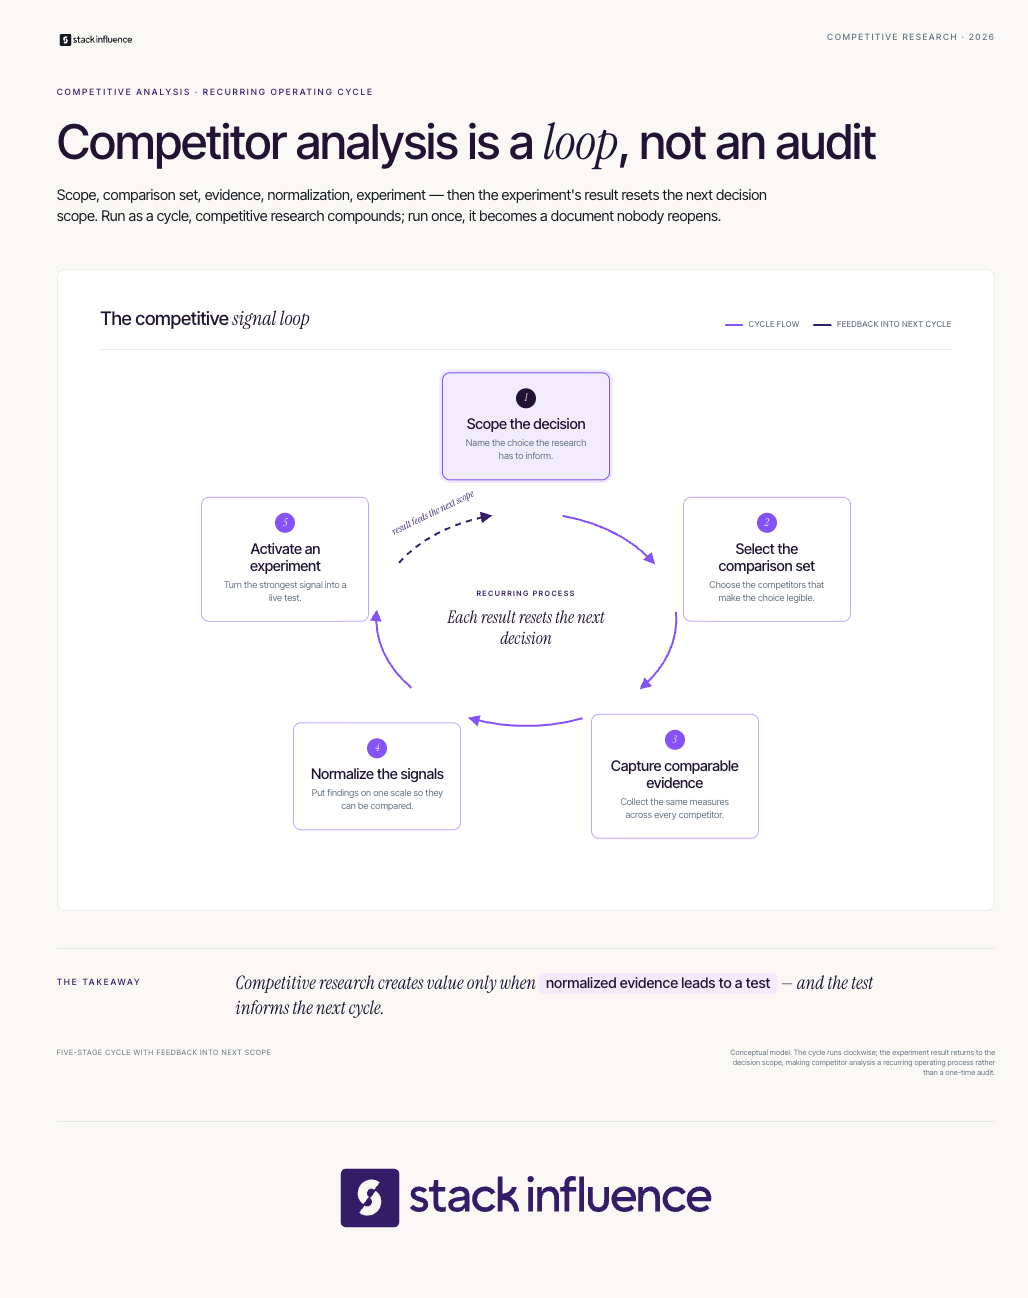
The Competitive Signal Loop turns public social activity into decisions and prevents research without a clear business question.
- Scope the decision: Define what the analysis must help you choose, such as a content format, campaign theme, creator strategy, launch message, or platform priority.
- Select the comparison set: Choose direct, adjacent, attention, and emerging competitors that illuminate different parts of the market.
- Capture comparable evidence: Gather the same fields, time window, and content sample for every account.
- Normalize the signals: Adjust for platform, format, audience size, posting volume, paid support, and metric definition.
- Activate an experiment: Convert the strongest pattern into a controlled content or campaign test.
The loop should repeat, not end. A lightweight content tracking system lets the team preserve observations, test results, and strategic decisions instead of restarting from zero every quarter.
Which Competitors Should You Analyze?
Analyze a compact portfolio of competitors that explains both your commercial market and your audience’s attention market. A practical starting set includes three direct competitors, two adjacent brands, one attention leader, and one emerging challenger. The exact number matters less than choosing accounts that answer different strategic questions.
Use four competitor types:
- Direct competitors: Brands with similar products, price points, channels, and customer profiles.
- Adjacent competitors: Brands solving the same customer problem with a different product or business model.
- Attention competitors: Accounts your target audience follows for education, entertainment, identity, or community.
- Emerging competitors: Smaller or newer brands gaining momentum through a distinctive format, creator network, or offer.
Pair larger reference brands with closer operational peers. A global company’s media budget, celebrity access, or distribution advantage may make its visible results difficult to reproduce.
Ecommerce teams should connect social research with marketplace research. The same competitor may use creator videos to generate awareness, search ads to capture demand, and optimized marketplace listings to convert it. A broader Amazon competitor analysis can reveal whether the social strategy aligns with pricing, reviews, keywords, and product positioning.
What Data Should You Collect?
Collect data that explains a competitor’s publishing system, creative choices, audience response, paid support, creator activity, and conversion path. Follower count alone is not enough. The evidence set should show what the competitor repeatedly does, how people respond, and what action the content appears designed to produce.
Capture the following fields for each account:
- Profile and positioning: Bio language, promise, target customer, proof points, link destination, and recurring offer.
- Publishing behavior: Post frequency, active platforms, content formats, recurring series, and timing patterns.
- Creative architecture: Topic, hook, visual style, opening frame, creator presence, demonstration, proof, CTA, and offer.
- Audience response: Public views, likes, comments, shares, visible sentiment, common questions, and brand reply behavior.
- Paid and partnership activity: Active ads, paid partnership labels, sponsored creators, affiliate language, creator codes, and reused UGC.
- Commerce pathway: Landing pages, marketplace links, featured products, bundles, discount structure, and checkout destination.
Use platform-native sources before relying on third-party estimates. Meta’s Ad Library shows ads currently running across Meta technologies, while TikTok’s Top Ads dashboard surfaces high-performing auction ads that can be filtered by variables such as region and objective. These tools help separate an organic content pattern from a creative idea receiving paid distribution.
LinkedIn Page admins can use competitor analytics to compare follower and organic content metrics and review trending competitor posts from the prior 30 days. On YouTube, the Audience tab can show what your own viewers watch outside your channel, which helps identify attention competitors and collaboration opportunities.
A guide to social media listening tools can help teams capture recurring complaints, category phrases, product requests, and shifts in audience conversation that profile metrics miss.
Normalize Before You Compare
Normalization is what turns a spreadsheet into analysis. Without it, a team may compare a boosted video with an organic carousel, an established account with a new challenger, or a follower-based engagement rate with an impression-based rate and reach the wrong conclusion.
Use consistent formulas and label every denominator:
- Engagement by followers: Total public interactions divided by follower count, multiplied by 100.
- Engagement by exposure: Total interactions divided by reach or views, multiplied by 100.
- Posting efficiency: Total interactions divided by the number of posts in the measured period.
- Hit rate: The percentage of posts that exceed the median result for the selected competitor set.
- Share of attention: A brand’s tracked mentions divided by all tracked mentions in the comparison set.
LinkedIn defines Page engagement rate as interactions divided by impressions, with interactions including clicks, reactions, comments, and shares. That definition should not be compared directly with a tool using followers as the denominator.
Apply the same discipline to trend data. Google explains that Google Trends data is normalized by time and location and then scaled from 0 to 100. It reflects relative search interest, not absolute search volume, and Google recommends treating it as one data point rather than proof that a topic is “winning.”
A useful social media analytics dashboard should record the formula, source, date range, and data-access limitation beside every metric. That small habit prevents false precision later.
Read Content Like a Strategist, Not a Fan
Strong competitor analysis explains why a content pattern may work. It does not stop at “Reels performed well” or “this post went viral.” The analyst should code the strategic components inside the post.
Evaluate each content sample through eight lenses:
- Audience job: What is the viewer trying to learn, feel, avoid, compare, or accomplish?
- Hook: What creates the first moment of relevance or curiosity?
- Format: Is the idea delivered through a demo, story, list, comparison, reaction, testimonial, or tutorial?
- Proof: Does the post use evidence, a product demonstration, creator experience, customer comment, or result?
- Creator role: Is the message delivered by the brand, a founder, an employee, a customer, a nano influencer, or a micro influencer?
- Offer: What product, benefit, promotion, or next step is emphasized?
- Friction: What objection or uncertainty does the content reduce?
- Comment evidence: What questions, doubts, use cases, and emotional reactions appear in the replies?
This coding method exposes reusable principles without copying surface details. The real lesson may be a fast demonstration, a specific objection, and a realistic use setting rather than a particular audio track or visual style.
For ecommerce teams, the broader ecommerce social media marketing workflow helps connect those creative choices to discovery and conversion. The relationship between micro-influencers and UGC in ecommerce is especially important because creator content can appear on creator profiles, brand feeds, ads, product pages, and marketplaces.
How Do You Turn Findings Into Better Content?
Turn every meaningful finding into a written hypothesis, a controlled test, a success rule, and a follow-up decision. A competitor pattern is not a strategy until your team explains why it may work for your audience and designs a test that can confirm, reject, or refine that explanation.
Use this four-part conversion:
- Observation: State only what the evidence shows.
- Hypothesis: Explain the audience or creative mechanism that might account for the pattern.
- Test: Change one meaningful variable while holding the rest of the execution reasonably consistent.
- Decision rule: Define in advance what result would justify repeating, revising, or stopping the approach.
For example, an observation might be that several competitors use customer-style product demonstrations in their most discussed posts. The hypothesis could be that realistic use reduces uncertainty better than polished product photography. The test would compare a creator-led demonstration with the brand’s standard creative while using the same product, offer, audience, and measurement window.
An influencer seeding workflow for ecommerce can turn that hypothesis into a repeatable creator test rather than a one-off post. The result should still be evaluated on its own evidence, not assumed from competitor performance.
The Overlooked Layer: Paid, Creator, and Commerce Signals
Most basic audits undercount the system behind a competitor’s feed. A brand may support organic posts with paid media, distribute products to UGC creators, activate brand ambassadors, sponsor micro-influencers, syndicate creator content, or direct traffic to Amazon, Shopify, and retail partners.
Classify creator posts carefully. The FTC’s disclosure guidance for social media influencers states that a material connection can include payment, employment, a family relationship, or free or discounted products. Meta also requires the paid partnership label for organic branded content on Instagram. A visible disclosure is useful evidence, but the absence of one does not prove that a post had no commercial relationship.
Influencer marketing and competitor analysis intersect at the surrounding creator network. Track:
- Number and type of creators posting
- Repeated briefs, claims, hooks, and product use cases
- Nano-influencer versus micro-influencer participation
- Organic creator posts versus partnership ads
- Content reuse across brand channels
- Affiliate, ambassador, and product-seeding signals
- UGC quality, variety, and commercial usefulness
Stack Influence is a micro-influencer marketing platform built around gifted-first product seeding, vetted creator activation, campaign coordination, UGC generation, and completed-post accountability. Its workflow is designed for ecommerce brands that want to move from a competitive insight, such as insufficient real-world product demonstrations, into a structured creator-content program.
The Magic Spoon case study shows why the scorecard should extend beyond social engagement. During a 12-month hero-product campaign, 3,448 creator promotions generated 5.82 million social impressions and 211,000 engagements. Average monthly unit sales increased from 1,937 to 7,867 during the measured campaign period, while Amazon Best Seller Rank moved from #828 to #181. These outcomes occurred during the campaign and should not be treated as a forecast for another brand.
Additional Stack Influence customer stories show how creator volume, engagement, marketplace rank, and sales can be reported together.
How Should You Measure Competitor Performance?

Measure competitor performance with a four-layer scorecard covering delivery, resonance, intent, and business outcomes. Public competitor data is strongest at the first two layers and weakest at the final two. Treat unavailable conversion data as unknown, not as permission to invent an estimate or assume that visible engagement produced profit.
Use four measurement layers:
- Delivery and visibility: Posting cadence, format mix, public views, follower growth, creator participation, active ads, and channel coverage.
- Resonance: Comparable engagement rates, comment quality, public shares, recurring questions, and response behavior.
- Intent: Profile actions, landing-page changes, promotional language, branded search movement, affiliate links, and calls to action. Label competitor intent data as a proxy.
- Business outcomes: For your own brand, connect social activity with qualified traffic, conversions, revenue, acquisition cost, marketplace sales, keyword movement, content reuse value, and repeat purchase. Treat competitor outcomes as private unless independently verified.
Attribution is strongest when your own campaign uses tagged links, platform reporting, creator-specific identifiers, controlled landing pages, and a defined baseline. The guide to tracking influencer-driven leads and sales explains how awareness and conversion signals can be connected without claiming that one visible metric caused the final result.
Use a 30-day view for creative decisions and a quarterly view for durable shifts in positioning, creator activity, channel investment, and customer conversation. Keep the windows consistent across competitors.
A Practical 30-Day Workflow
A 30-day cycle can establish a comparable baseline while producing an immediate content decision. Later cycles become faster once the competitor set, coding rules, formulas, and reporting format are established.
Week 1: Define the Decision and Baseline
Choose one business question, such as which creative format to test for a launch or which audience objection deserves more content. Confirm the competitor set, platforms, date range, metric definitions, and your own baseline.
Week 2: Capture and Code Evidence
Collect the agreed content sample for every account. Code each post by topic, hook, format, proof, creator role, CTA, offer, and audience response. Save links and screenshots with dates because posts, captions, and ad status can change.
Week 3: Find Patterns and Build Hypotheses
Calculate normalized metrics, identify repeated creative structures, read comments, and separate paid from organic signals. Prioritize patterns that appear across multiple posts or competitors rather than one viral outlier.
Week 4: Launch Tests and Document Decisions
Run one or two focused experiments with predetermined success rules. Record what changed, what stayed constant, what happened, and what the team will do next. A clear reporting cadence is more valuable than a large dashboard nobody uses.
Keep the scorecard connected to the content calendar, creator pipeline, campaign briefs, and measurement dashboard.
Common Social Media Competitor Analysis Mistakes
The most damaging mistakes make a polished report look more certain than the evidence allows.
- Tracking too many accounts: An oversized comparison set creates maintenance work without improving the decision.
- Mixing metric definitions: A follower-based engagement rate cannot be treated as equivalent to an impression-based rate.
- Ignoring paid amplification: A heavily promoted post should not become the organic benchmark.
- Copying the visible execution: Replicating a hook, audio track, or visual style does not reproduce the audience insight behind it.
- Overvaluing one viral post: Outliers may reflect timing, controversy, paid distribution, creator reach, or randomness.
- Treating comments as decoration: Questions and objections often contain more strategic value than the headline engagement number.
- Assuming public activity equals business success: High visibility may coexist with weak conversion, poor margins, or an unprofitable acquisition model.
- Ending with observations: A report that produces no test, owner, deadline, or decision has not completed the Competitive Signal Loop.
Social Media Competitor Analysis Should Produce Decisions
The purpose of social media competitor analysis is not to create a prettier benchmark deck. It is to reduce uncertainty before your team invests time, inventory, creator relationships, and media budget.
Choose a focused competitor set, collect comparable evidence, normalize the metrics, separate paid and organic activity, and turn the strongest pattern into a controlled experiment. For ecommerce brands that identify a creator-content gap, evaluating a managed Stack Influence product-seeding workflow can provide a practical next step toward vetted participation, completed UGC, and a more measurable campaign system.