


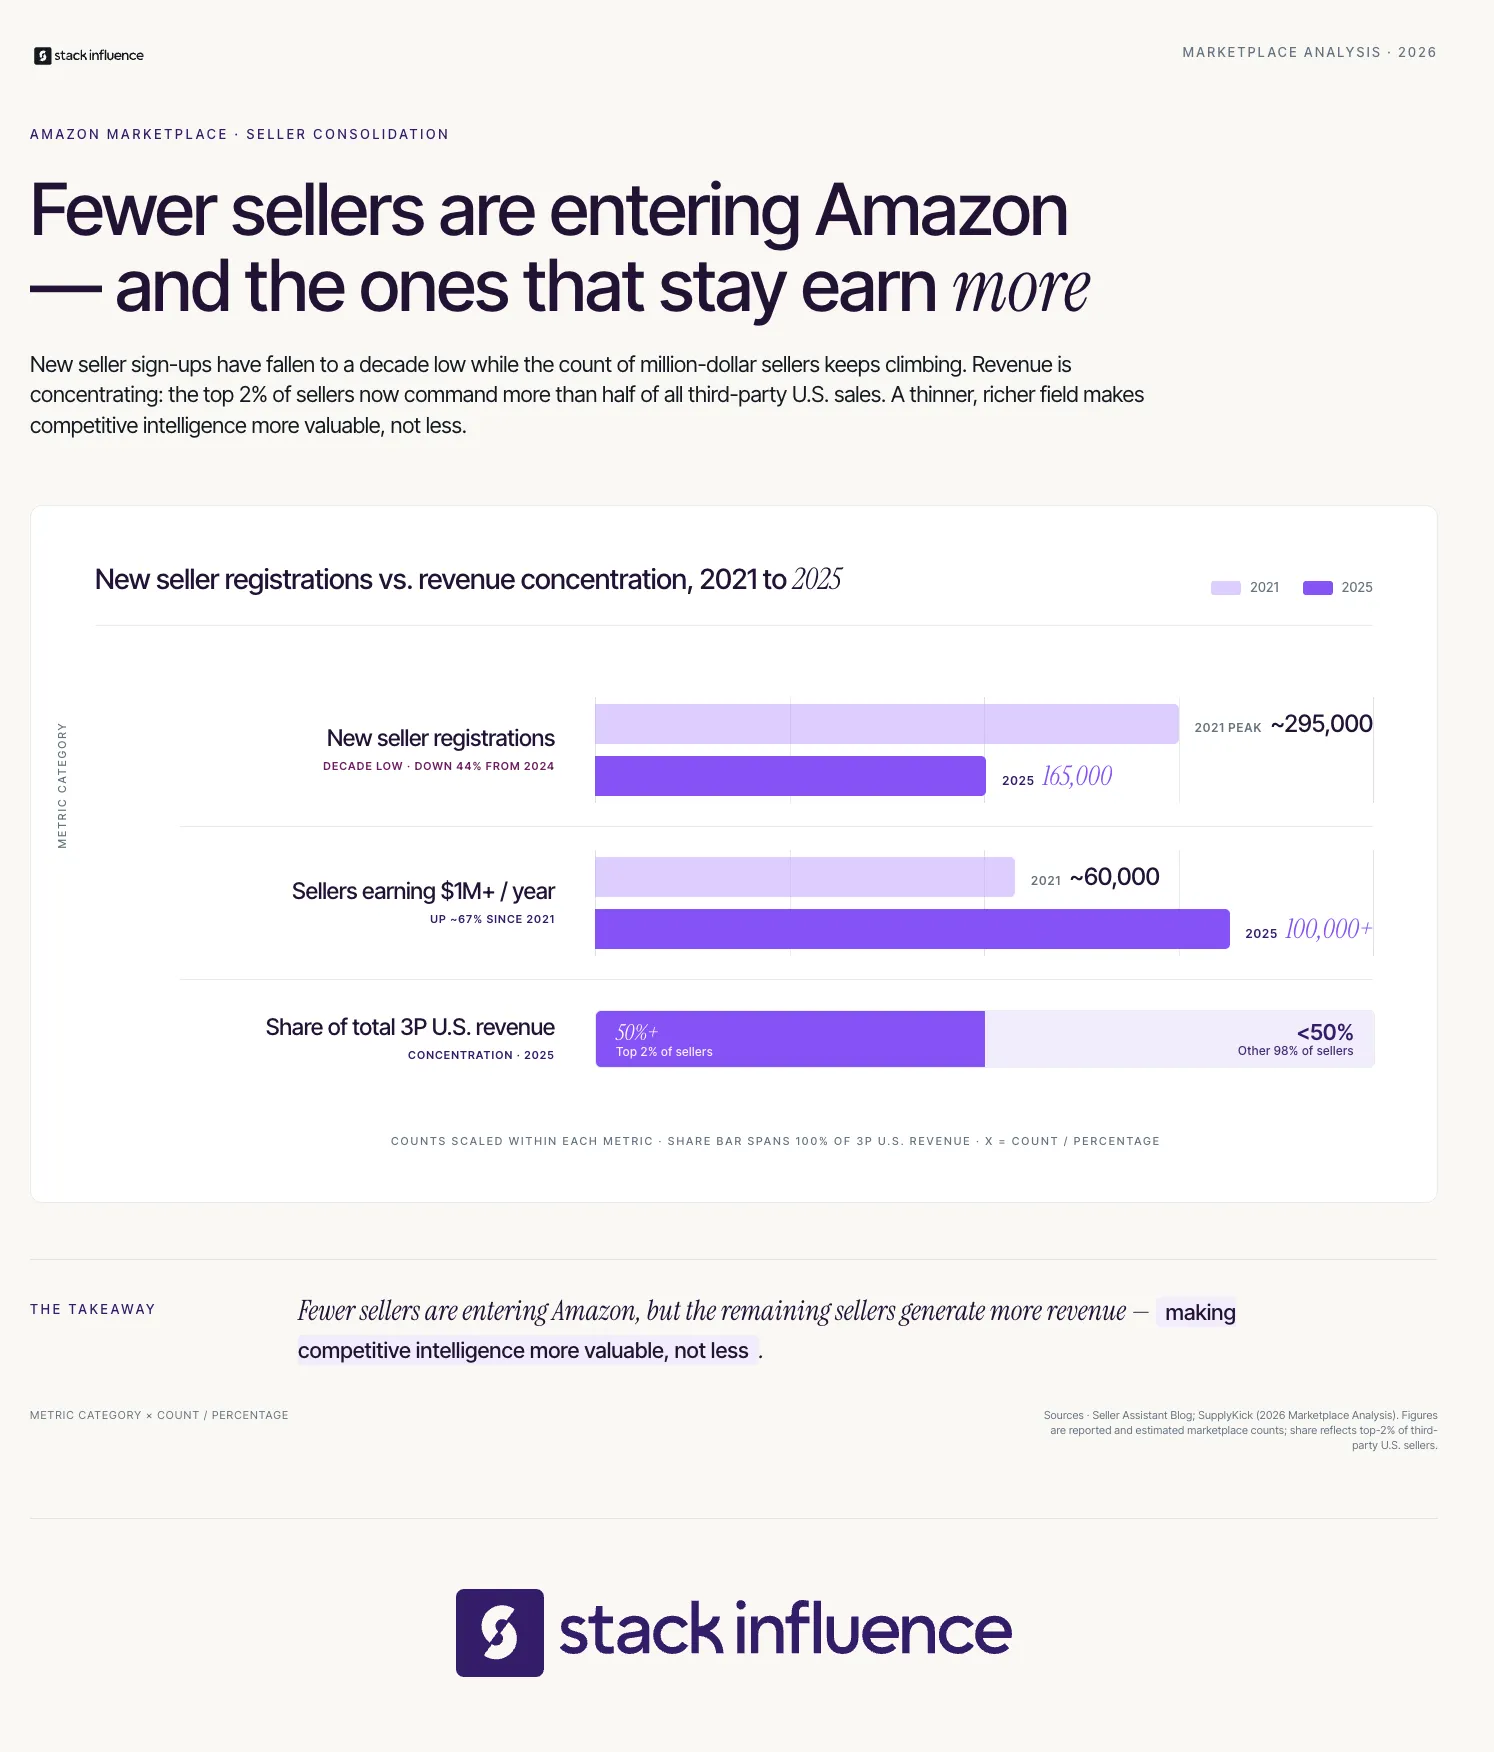
Most eCommerce sellers check their own sales dashboard every morning. Far fewer spend equal time studying the sellers who are quietly eating into their category. That gap is where competitive advantage is made or lost on Amazon. The Amazon marketplace is consolidating fast: active sellers have dropped from 2.4 million to 1.65 million, new registrations hit a decade low of 165,000 in 2025, yet third-party sellers now account for 62% of units sold — an all-time high. A structured amazon competitor analysis is no longer optional for serious Amazon FBA and DTC brands. This guide gives you a repeatable system to map the competitive field, find the gaps rivals leave open, and measure the actions that actually move market share.
Key Takeaways
- Amazon competitor analysis is the process of systematically tracking rival listings, keywords, pricing, reviews, and advertising strategy to find exploitable gaps.
- The marketplace is consolidating around a small group of high-revenue sellers, making category intelligence a core operating requirement rather than a one-time exercise.
- A five-step framework called the Competitive Clarity System gives sellers a repeatable process for running and acting on competitor research.
- Amazon Brand Analytics and the Search Query Performance dashboard are the most underused free tools available to brand-registered Amazon sellers.
- Amazon Attribution and the Amazon Brand Referral Bonus together reduce the effective cost of external traffic campaigns by an average of 10%, compounding the value of competitive intelligence when applied to off-platform channels.
- Measurement must go beyond keyword rank: a named metric model called the Market Position Stack tracks the four numbers that actually signal competitive movement.
How to Build a Repeatable Competitor Intelligence Process
With sellers joining the Amazon marketplace each day, existing sellers need to conduct Amazon competitor analysis to keep a finger on the pulse of the landscape — understanding exactly how competitors price their products, source their inventory, build their listings, and market off-platform. The challenge is that most sellers do this reactively, pulling data only when a listing tanks or a new rival appears. A proactive system changes that.
The framework introduced here is called the Competitive Clarity System, a five-step numbered sequence that runs on a defined cycle. It is designed for Amazon sellers and DTC brands who want to move from guesswork to structured intelligence. Competitor analysis is no longer optional for Amazon sellers; it is a core driver of profitability, with the right tools revealing market share shifts, keyword opportunities, pricing trends, and social chatter before they become visible on Amazon's front end.
Here is how sellers typically fail at this process before finding a system:
- They analyze competitors once during product launch and never revisit the data.
- They track keyword rank without connecting it to competitor share of impressions.
- They benchmark on price alone, ignoring review velocity, listing quality, and off-Amazon traffic behavior.
- They measure BSR without modeling the revenue trajectory behind it.
The Competitive Clarity System is structured to fix each of those failure points.
What Is Amazon Competitor Analysis, and Why Does It Matter Now?
Amazon competitor analysis is the ongoing process of identifying, monitoring, and drawing strategic insights from the sellers, listings, and advertising behaviors that compete for the same shopper attention you are targeting. This analysis helps sellers understand how competitors position themselves in the market, their pricing strategies, the keywords they rank for, and how well their listings perform. The definition is simple; the execution is where most sellers fall short.
The market context in 2026 makes this work more urgent than ever. Amazon registered approximately 165,000 new sellers in 2025, the lowest annual number in a decade and a 44% decline compared to 2024, reflecting rising advertising costs, higher platform fees, and stronger competition that make launching a profitable Amazon business more challenging than it was several years ago. What this means for existing sellers is that remaining competitors tend to be better-capitalized, more experienced, and more data-driven. Knowing exactly who they are and how they operate is fundamental to staying ahead.
New seller registrations hit a decade low of 165,000 in 2025, down 44% from the 2020 peak. The marketplace is top-heavy: the top 1% of sellers capture about 27% of total revenue. For sellers in competitive categories, that concentration means ignoring the top tier is not a viable strategy.
Key reasons to run structured competitor analysis now:
- Category intelligence: Spot the top performers in your niche and understand what differentiates them.
- Keyword opportunity mapping: Find high-intent search terms where competitors are winning clicks you are not capturing.
- Pricing and margin modeling: Understand where competitors hold price or where they discount, and when.
- Review gap discovery: Identify product and experience weaknesses in competitor listings that your own offering can address.
- Ad strategy reverse-engineering: Observe which sponsored placements competitors prioritize and which keywords they contest most aggressively.
The Competitive Clarity System: A 5-Step Framework
The Competitive Clarity System is a sequential, repeatable process that runs on a monthly cycle. Each step builds on the previous one, moving from identification through action. This is the primary framework used throughout this article, and it is referenced whenever a tactic connects back to a specific step.
Step 1: Identify Your Real Competitor Set
Most sellers define their competition too broadly. The relevant competitive set for any product is the group of ASINs that rank in the top 20 organic results for your three highest-converting keywords. To get the most out of competitor analysis tools, identify main competitors by searching target keywords and noting the best-performing listings, then analyze sales history with tools like Helium 10 or Jungle Scout to study trends and demand. Run this exercise on your primary keyword and your two strongest secondary keywords. The overlap between those three lists gives you your core competitive set, typically five to twelve ASINs.
Step 2: Build a Listing Intelligence Profile
For each competitor in your core set, build a structured profile. An effective competitor analysis should compile revenue over time, sales over time, estimated fees, number of active sellers, review count, and review velocity — then cross-reference the keywords a competitor's listing ranks for using reverse-ASIN research. This profile becomes your living comparison document, updated monthly.
Key items in a listing intelligence profile:
- ASIN and current BSR across primary category and relevant subcategories
- Review count and velocity (how many new reviews per week)
- Listing quality markers (A+ Content presence, video in listing, image count and quality)
- Pricing history tracked over 30, 60, and 90-day windows
- Fulfillment method (Amazon FBA vs. FBM and its impact on Prime badge and Buy Box eligibility)
Step 3: Run Keyword Share-of-Voice Analysis
This is the step the Competitive Clarity System most distinguishes from a one-time audit. The most valuable piece of information in the Search Query Performance report is first-party data from Amazon on search volume and your brand's share of that search volume, including the Search Query Score that shows which queries drive the most sales.
The Search Query Performance dashboard shows data for impressions, clicks, cart adds, and other sales metrics for specific queries and provides a breakdown of your brand's share of performance compared to overall query performance in the Amazon store — including the percentage of clicks for your brand's catalog compared to the total count for all brands. When you know your impression share for a keyword, you can calculate exactly how much opportunity you are leaving to competitors.
Steps for share-of-voice analysis:
- Pull Search Query Performance data for your top 20 keywords monthly.
- Record your ASIN click share and purchase share for each term.
- Compare month-over-month to detect whether competitors are gaining or losing ground.
- Flag any keyword where your click share drops by more than 5% in a single month for immediate investigation.
Step 4: Analyze Competitor Review and Sentiment Patterns
Reviews are structured competitive intelligence, not just social proof. Sentiment analysis of customer reviews reveals how shoppers feel about competitor products, uncovering weaknesses you can address in your own listing or product development roadmap. Specifically, scan the one- and two-star reviews of your three closest rivals for recurring themes. If three different competitor reviews mention the same pain point, that is a product differentiation signal.
Stack Influence's internal campaign data shows that Amazon sellers who systematically mine competitor reviews for product and messaging gaps before running micro influencer campaigns see significantly higher content relevance scores than sellers who brief creators based on internal assumptions alone. Review mining reveals the actual language customers use, which makes creator briefs sharper and product claims more credible.
Step 5: Track Competitor Ad Strategy and Off-Platform Signals
When analyzing the keywords a competitor is targeting in their PPC campaigns, look for trends — for example, if a competitor is targeting many third-party seller brand names, that same keyword list can inform your own video ad strategy. Beyond on-platform PPC, watch for signs that a competitor is building external traffic. Check whether their Amazon storefront has been recently updated, whether they are running a Brand Store with curated editorial content, and whether their organic search rankings shift in ways that suggest off-platform traffic boosts to the A9 algorithm.
The Competitive Clarity System completes its cycle here. Every month, steps 1 through 5 produce a data set that feeds directly into listing optimization, ad strategy, and product development decisions.
What Most Guides Get Wrong About Competitive Intelligence
Here is the specific belief this section challenges: most Amazon sellers treat competitor analysis as a keyword and pricing exercise. They assume that if they match or undercut rivals on price and rank for the same terms, the competitive problem is solved.
More than 60% of the top 10,000 Amazon sellers registered before 2019, and veterans control the top slots. The top 2% of sellers generate over 50% of total third-party revenue in the U.S. — revenue is concentrating at the top while the long tail shrinks. These sellers are not winning on price. They are winning on brand infrastructure: storefronts, A+ Content, external traffic flywheels, and review moats built over years.
The specific alternative metric most guides skip is share-of-voice trajectory, not share of voice at a single point in time. A competitor with 8% click share on your primary keyword is not the same threat as a competitor who has moved from 4% to 8% in ninety days. The trajectory matters far more than the snapshot. In Amazon's Search Query Performance dashboard, tracking impression share for top 10 to 20 keywords as a trend over time is a clear sign of capturing or losing market share.
The actionable replacement this week: open your Search Query Performance dashboard, pull data for your top ten keywords over the past three months, and build a simple trend line for your click share per term. Any term where a competitor is gaining more than two percentage points per month is a keyword defense priority, not a launch opportunity.
From Stack Influence's experience running Amazon seller influencer campaigns, sellers who track share-of-voice trajectory monthly and connect competitor SOV gains to their own listing response times outperform peers by a measurable margin in share recovery after competitive disruptions.
How the Competitive Clarity System Connects to Off-Platform Strategy
The Competitive Clarity System operates inside Amazon's ecosystem. But the most overlooked competitive lever for Amazon FBA sellers is external traffic, specifically the structural advantage it creates in both organic ranking and unit economics. Amazon has been rewarding sellers who direct off-Amazon traffic to their listings with higher search rankings, helping sellers track their off-Amazon sales through Amazon Attribution. This means competitive intelligence that reveals a rival building external traffic is a signal to respond with your own off-platform investment, not just a note to file away.
Social media posts featuring user-generated content drove 10.38 times higher conversion rates compared to non-UGC posts, according to Emplifi's Q3 2025 Social Media Benchmarks report. For Amazon sellers using micro influencer product seeding to generate UGC, this creates a compounding advantage: the content improves Amazon listing conversion rates while simultaneously driving external traffic that the A9 algorithm rewards with organic ranking gains.
The Amazon solutions for brands that connect micro influencer campaigns directly to Amazon storefronts unlock the full loop: creator content drives external traffic, Attribution tags credit the sale, and the Brand Referral Bonus offsets part of the referral fee on every attributed conversion.
Here is how to build the external traffic layer into your competitive response:
- Identify which of your competitor's top keywords you currently underperform on in SOV analysis (Step 3).
- Build an external campaign sending creator traffic to your Amazon storefront or product page, tagged with Amazon Attribution links.
- Track the organic rank movement for those keywords over the 30 days following campaign launch.
- Compare your listing's click share before and after the campaign to quantify the organic impact.
Across campaigns managed on the Stack Influence platform, Amazon sellers who pair micro influencer traffic campaigns with a structured share-of-voice tracking cycle see measurable organic rank improvements on targeted keywords within 45 to 60 days of campaign completion, particularly in sub-categories where organic rankings are sensitive to conversion velocity.
The Pre-Launch Competitive Audit: A Secondary Framework

Beyond the monthly Competitive Clarity System cycle, there is a separate process that applies specifically before launching a new product or entering a new subcategory. This is the Pre-Launch Competitive Audit, a named checklist framework designed to confirm market viability before investment.
The Pre-Launch Competitive Audit has six items:
- Demand validation: Confirm at least three competitors in the target category each generate an estimated minimum monthly sales volume that justifies the category size.
- Review barrier assessment: Count the average review total of the top five listings. Categories where the top five listings average more than 2,000 reviews require a longer launch runway and a stronger review acquisition strategy.
- Pricing floor modeling: Map the lowest price point among the top fifteen listings. If the floor sits below your target margin threshold, the category economics are probably not viable at launch.
- Keyword coverage gap: Run a reverse-ASIN on the top three competitors. Using a tool like Cerebro, uncover competitor keywords by entering an ASIN, while Market Tracker 360 keeps tabs on market share and Xray delivers insights on monthly sales, revenue, Best Seller Rank, and FBA fees. Flag any high-volume keywords the top three do not rank for organically — these are your early keyword targets.
- Ad cost benchmark: Check the CPC range for your primary keyword. Q4 drives 30 to 35% of annual seller revenue, with CPC costs rising 40 to 60% during peak season. Model whether your target ACoS is achievable at category CPC rates year-round, not just during off-peak windows.
- External traffic audit: Check whether top competitors operate an Amazon storefront with editorial content, maintain active social presence with linked Amazon storefront pages, or show signs of structured influencer seeding campaigns. If three or more do, you will need an equivalent off-platform strategy from day one.
The Pre-Launch Competitive Audit is distinct from the Competitive Clarity System in scope and timing. The Audit runs once before entry. The System runs monthly for active listings. Both are required for sellers who operate in competitive sub-categories.
How Do You Measure Competitive Progress Over Time?
Tracking competitor activity without a structured measurement model creates data noise. The Market Position Stack is the named metric model for this article, and it defines the four numbers that together signal whether a brand is gaining or losing competitive ground.
The Market Position Stack has four components:
- SOV Index: Your average click share across your top ten keywords, tracked as a monthly trend. This is the primary signal of competitive momentum. Amazon provides share-of-voice metrics showing how your brand or ASIN performs relative to the category; you can see your share of impressions or clicks for a particular search term, helping identify gaps where competitors are winning attention and conversions.
- Review Velocity Differential: The difference between your weekly new review rate and the average weekly new review rate of your top three competitors. A positive differential means you are building social proof faster; a negative differential is an early warning sign of listing stagnation.
- Attributed Traffic Conversion Rate: For sellers running external campaigns using Amazon Attribution, this is the conversion rate on traffic arriving via Attribution links versus organic Amazon traffic. The Attribution flow runs from external click to tag fire to shopper landing on the Amazon listing or storefront, then to purchase within 14 days, after which Amazon calculates the Brand Referral Bonus and the credit appears in the seller's account.
- Brand Referral Bonus Yield: The total referral fee credits earned per month as a percentage of gross external-traffic-driven revenue. With Amazon's Brand Referral Bonus, enrolled brands can earn a bonus averaging 10% of qualifying sales when they drive traffic to products from search, social media, and other sources outside Amazon, with bonuses accumulating as credits that offset future referral fees. Tracking this as a percentage reveals which external channels are producing the highest effective fee reduction.
These four numbers together give a complete picture: organic visibility, social proof trajectory, external traffic efficiency, and cost structure impact. No single number tells the full story. The Market Position Stack is designed to be reviewed alongside the Competitive Clarity System output each month.
Brands using the influencer seeding workflows that generate ongoing UGC should also track the volume of creator content that features Amazon storefront links, since each tagged piece of content contributes to Attributed Traffic Conversion Rate in the Market Position Stack.
Building Your Competitive Intelligence Workflow
Competitive intelligence is only useful if it connects to decisions. The final step in applying the Competitive Clarity System is building a workflow that converts monthly analysis into a concrete action list.
Based on Stack Influence's work with eCommerce brands managing ongoing Amazon competitor analysis, sellers who assign each of the five Competitive Clarity System steps to a specific team member or role and set a fixed monthly review date act on insights three times faster than sellers who treat competitor research as an ad-hoc project.
A practical workflow structure looks like this:
- Week 1: Run Step 1 and 2 (competitor identification and listing intelligence update). Note any new entrants in the top 20 organic results.
- Week 2: Run Step 3 (share-of-voice analysis). Pull Search Query Performance data and update your SOV Index in the Market Position Stack.
- Week 3: Run Step 4 (review and sentiment analysis). Update review velocity differential and flag any competitor weakness themes for listing copy or product development.
- Week 4: Run Step 5 (ad strategy review) and compile a full Market Position Stack update. Identify the one keyword defense priority and the one external traffic opportunity to pursue in the next cycle.
This weekly structure keeps the Competitive Clarity System alive without overwhelming operations. Each week's work takes between 45 minutes and two hours depending on category size and the number of ASINs tracked.
For sellers exploring UGC and product seeding strategies as a response to competitor differentiation, the pre-launch Competitive Audit should identify whether UGC content volume is a gap among existing competitors — if it is, it becomes the highest-leverage action in the campaign plan. To explore how micro influencer campaigns for Amazon sellers can feed directly into your competitive intelligence cycle, review the platform-specific workflows designed for Amazon brand owners.
Conclusion
Amazon competitor analysis is not a research project. It is an operating discipline that separates sellers who grow market share deliberately from those who discover they have lost it too late to respond. The Competitive Clarity System gives eCommerce sellers a five-step monthly process for building and acting on competitive intelligence. The Pre-Launch Competitive Audit adds a structured entry-gate before any new product investment. The Market Position Stack gives sellers four numbers that together show whether competitive momentum is moving in their favor. When paired with Amazon Attribution tracking, the Amazon Brand Referral Bonus, and external traffic strategies built around the same keyword opportunities the analysis reveals, these frameworks compound into a durable competitive advantage. The sellers winning in 2026 are running systems, not gut checks.