




Inventory decisions force ecommerce sellers into a costly tradeoff. Buy too much and cash sits in slow-moving stock. Buy too little and a product launch, promotion, or creator campaign can empty a hero SKU before replenishment arrives.
Inventory demand forecasting gives Amazon sellers, Shopify merchants, and DTC brands a disciplined way to estimate future unit demand and turn it into purchase orders. The goal is not perfect prediction. It is a repeatable system that separates baseline demand from planned events and connects marketing decisions to inventory, fulfillment, and cash.
Key Takeaways
- Forecast the buying decision: Estimate units by SKU, channel, location, and period, then translate the result into reorder timing and order quantity.
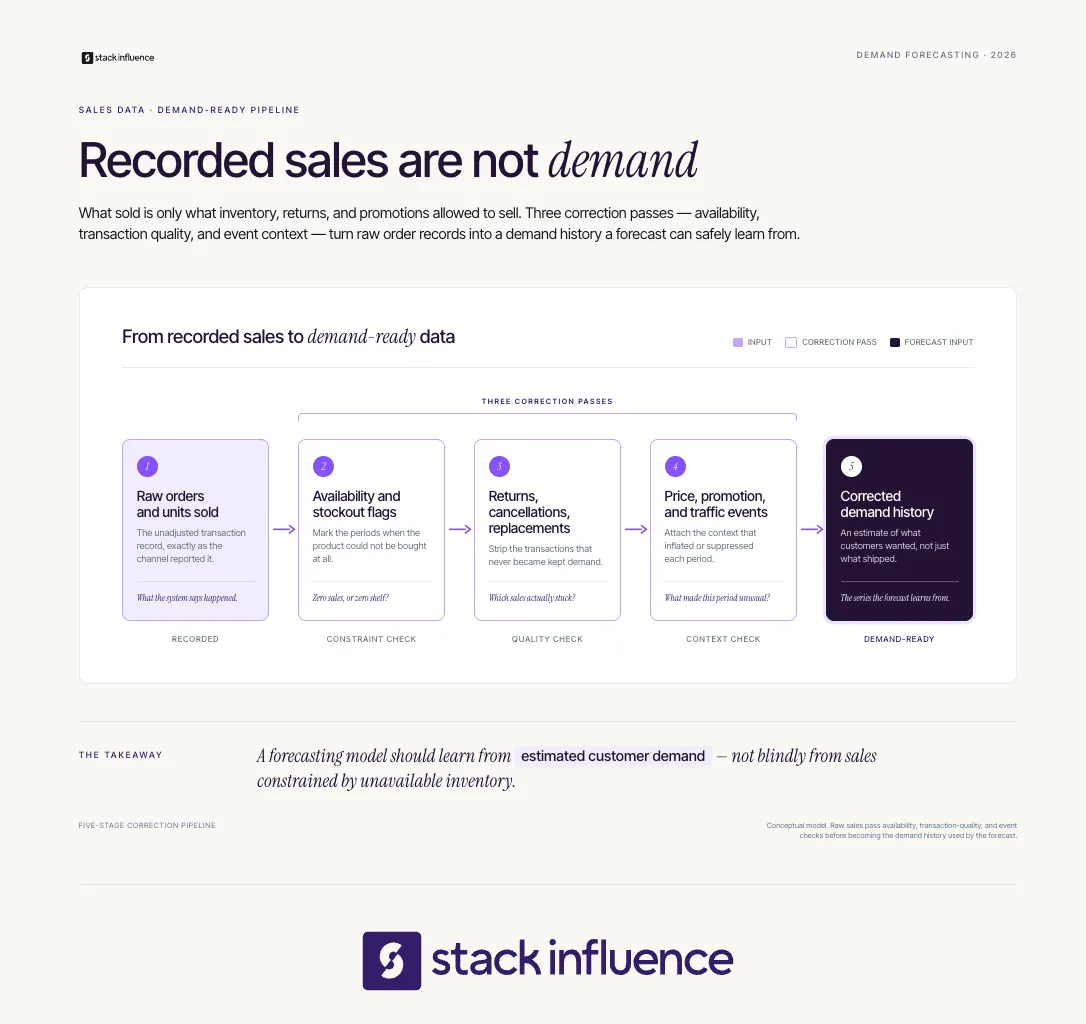
- Correct the history first: Recorded sales can understate demand when a product was unavailable, suppressed, or constrained.
- Separate baseline from events: Promotions, price changes, Amazon influencer activity, and product seeding should be modeled explicitly rather than buried inside an average.
- Use scenarios, not false precision: Low, base, and high cases are more useful than one exact launch number.
- Measure business outcomes: Forecast error matters, but in-stock rate, excess inventory, expedite costs, and cash tied up determine whether the process creates value.
What Is Inventory Demand Forecasting?
Inventory demand forecasting is the process of estimating how many units customers are likely to buy over a defined period, then converting that estimate into replenishment decisions. A complete forecast accounts for expected demand, uncertainty, supplier lead time, sellable inventory, inbound stock, reserved units, and known events such as promotions or launches.
Demand forecasting predicts customer purchases. Inventory planning decides what to order, when to order it, and where to place it. Revenue forecasts help finance, but ecommerce buyers need unit forecasts by SKU because a dollar total cannot tell a warehouse how many blue medium shirts, refill packs, or Amazon FBA units to receive.
Small planning errors compound quickly at ecommerce scale. The U.S. Census Bureau reported $326.7 billion in seasonally adjusted U.S. retail ecommerce sales for the first quarter of 2026, up 9.8% from the first quarter of 2025 and equal to 16.9% of total retail sales.
Express the forecast at the level where a decision can be made:
- SKU: Which exact product or variant will sell?
- Channel: Will demand occur on Amazon, Shopify, wholesale, or another marketplace?
- Location: Which warehouse or fulfillment network needs the stock?
- Time: What will sell by day, week, or month?
- Scenario: What changes under low, base, and high demand?
Forecasting also needs to connect with the operational constraints described in why order fulfillment breaks ecommerce growth. A mathematically accurate forecast still fails if the team uses an unrealistic lead time, overlooks receiving delays, or cannot move units to the location where customers are buying.
Sales Are Not Demand When Availability Is Constrained
Recorded sales are only a clean demand signal when customers had a fair chance to buy. Once a SKU stocks out, loses the Featured Offer, becomes unavailable at a location, or is temporarily suppressed, sales become a censored version of demand. The historical file may show zero units even though customer interest remained.
Research published in the International Journal of Forecasting examines how lost-sales inventory policies affect demand forecasting, reinforcing a practical lesson for ecommerce teams: availability conditions belong in the data, not just in an operations note.
Before fitting a model, build a demand-ready dataset with:
- Order date and units ordered
- SKU, variant, channel, and location
- Price, discount, and promotion flags
- Ad spend, email sends, creator posts, and launch dates
- In-stock status and days available
- Returns, cancellations, and replacements
- Confirmed inbound inventory and stock transfers
- Supplier lead-time history, not only the quoted lead time
Shopify exposes fields such as days in stock, days out of stock, inventory units sold per day, and days of inventory remaining in its analytics field reference. Those availability fields help distinguish weak demand from weak availability.
Correct stockout periods conservatively. A practical method is to estimate lost demand from the SKU’s in-stock velocity immediately before and after the gap, adjusted for seasonality and campaign activity. Mark the correction as estimated so planners can compare raw sales, corrected demand, and the final forecast rather than hiding assumptions.
For Amazon sellers, the risk is broader than one missed order. A stockout can interrupt sales velocity and campaign timing, which is why running out of inventory can affect Amazon rank. The forecast should flag days when marketing is scheduled but sellable stock may fall below the campaign requirement.
The Baseline-to-Buy Forecasting Framework
The Baseline-to-Buy Forecasting Framework turns historical demand into a purchasing decision through five stages: establish the baseline, add event demand, create scenarios, translate demand into inventory, and review forecast error. Each stage has a separate job, which prevents promotions, safety stock, and ordinary customer demand from being counted twice.
1. Establish a Defensible Baseline
Start with the simplest method that reflects the SKU’s pattern. A sophisticated model is not automatically more accurate, and a basic seasonal baseline often provides a stronger benchmark than an unexplained software forecast.
Match the method to the demand pattern:
- Stable demand: Recent average, moving average, or a naive forecast
- Trend: Exponential smoothing with a trend component
- Seasonal demand: Seasonal naive or seasonal exponential smoothing
- Intermittent demand: Aggregated periods or an intermittent-demand method
- New product: Analog products, customer research, prelaunch signals, and scenarios
- Promotion-driven demand: Baseline plus explicit event variables
Use daily data for high-volume SKUs when replenishment can react daily. Weekly data is often more stable for lower-volume products. Monthly data may be too slow for brands running short campaigns or managing long lead times.
For new products, combine quantitative analogs with qualitative judgment. IBM’s demand forecasting tutorial notes that qualitative methods are especially useful when historical data is limited, which is the normal condition for a launch.
2. Add the Event Layer
The event layer adjusts the baseline for planned actions that can change demand. These include discounts, paid advertising, email campaigns, retail placements, Amazon storefront features, affiliate pushes, product launches, and creator partnerships.
For every planned demand event, record the affected SKU, channel, launch and end dates, offer, expected sales window, inventory reserved for execution, measurement tag, and low, base, and high unit assumptions. For Shopify campaigns, the workflow in the Shopify influencer marketing playbook helps connect creator activity, store traffic, and contribution margin before content goes live.
Amazon sellers can use Amazon Attribution to measure tagged non-Amazon search, social, display, video, and email activity. Amazon reports a 14-day attribution window and metrics including clicks, detail page views, add-to-cart actions, purchases, units sold, and product sales.
Use separate tags for major tactics so future forecasts can learn from actual event performance. Stack Influence’s Amazon Attribution guide explains how tagged external campaigns can support that reporting workflow.
A verified Stack Influence case study shows why creator activity needs an explicit scenario. During a three-month new-product campaign for Targus, average monthly unit sales increased from 56 at the starting point to 221 during the measured campaign period. The campaign included 120 creator promotions, 275,560 social impressions, and 4,323 engagements. The example does not prove that creator activity caused every sales change, but a baseline-only forecast would not have represented the observed demand shift.
Keep product-seeding inventory separate from consumer demand. Creator units, replacements, damaged shipments, and content samples reduce available stock even when they are not customer orders. The operational steps in these influencer product seeding strategies can be added to the same calendar.
3. Create Low, Base, and High Scenarios
A single forecast hides uncertainty. Build three cases around the assumptions that matter most, such as conversion rate, campaign reach, supplier timing, price, or repeat purchase.
- Low case: Weak event response, slower baseline, or an early campaign stop
- Base case: Most likely assumptions based on comparable history
- High case: Strong response that remains operationally plausible
Document each assumption in units, not adjectives. “Strong launch” is not auditable. “Baseline of 18 units per day plus 240 event units over two weeks” can be compared with reality.
Each scenario should trigger a decision. The low case may delay a second purchase order. The base case may reserve normal safety stock. The high case may require faster freight, a supplier option, or a marketing cap once weeks of supply falls below a threshold.
4. Translate Demand Into Inventory Decisions
A forecast becomes useful when it produces a reorder date and order quantity. The planning horizon must cover production, freight, customs, receiving, quality checks, warehouse transfer, marketplace check-in, and the next review period.
Use three linked calculations:
- Lead-time demand: Forecast units expected during total replenishment lead time
- Reorder point: Lead-time demand plus safety stock
- Inventory position: On-hand units plus confirmed inbound units minus backorders, reservations, and committed campaign stock
The preliminary order quantity is the target inventory position minus the current inventory position. Then adjust for minimum order quantities, case packs, shelf life, storage limits, cash constraints, and supplier reliability.
Suppose a SKU is forecast to sell 14 units per day, replenishment takes 42 days, the team reviews inventory every seven days, and safety stock is 110 units. Target stock is 796 units: 14 multiplied by 49 days, plus 110. If the inventory position is 355 units, the preliminary purchase order is 441 units before case-pack or MOQ rounding.
Safety stock should absorb the uncertainty left after expected demand is modeled. Planned promotion lift belongs in the forecast itself, while the buffer protects against forecast error, supplier variation, and unexpected demand. Treating the same lift as both planned demand and safety stock creates an inflated buy.
Shopify’s inventory reports calculate days of inventory remaining from ending inventory divided by average units sold per day, using recent sales to estimate depletion. That metric is a useful warning, but a campaign-aware forecast should replace the backward-looking average when a known event is approaching.
Amazon’s official demand forecast tool provides eligible sellers with estimated future demand for products for up to 40 weeks. Treat it as an input to compare with the brand’s own assumptions, not as a substitute for supplier, campaign, and cash planning.
Teams preparing a marketplace launch can pair the forecast with these Amazon launch strategies. Brands using shared inventory across channels should also define allocation rules before traffic scales, as described in the guide to Amazon Multi-Channel Fulfillment.
5. Review Error and Improve the Decision
Update the forecast on a fixed cadence and preserve prior versions. Without snapshots, a team can overwrite history and make the model look more accurate than it was.
Compare each model with a simple baseline. Forecasting: Principles and Practice explains that accuracy should be evaluated on data not used to fit the model, because a strong fit to training data does not guarantee strong forecasts. Its forecast accuracy guidance also notes that MAPE becomes undefined when actual demand is zero and unstable when actual demand is near zero.
For recurring evaluation, use rolling-origin testing. The textbook’s time-series cross-validation method repeatedly trains on past observations and tests on the next period, preventing future data from leaking into the forecast.
Record planner overrides separately from the statistical baseline. Then calculate whether the override improved or worsened error. This creates forecast value added, a practical way to identify useful judgment and eliminate habitual optimism.
Which Forecasting Method Fits Each SKU?
The right method depends on demand shape, value, lead time, and decision frequency. Ecommerce teams should not force every SKU through one model. Stable hero products can support tighter statistical planning, while volatile launches and long-tail items need wider scenarios, simpler rules, or more frequent human review.
Use a Value-Variability Map:
- High value, predictable: Detailed forecast, frequent review, tight availability targets
- High value, volatile: Scenario planning, event tracking, supplier options, wider buffers
- Low value, predictable: Automated reorder rules and lightweight exception review
- Low value, volatile: Conservative buys, limited availability, or make-to-order logic
This map complements ABC inventory analysis because revenue importance does not describe predictability. A high-revenue seasonal SKU and a high-revenue steady replenishment SKU deserve different models even when both are operational priorities.
Apply one governing rule: forecast at the level where the demand pattern remains meaningful. Splitting a slow SKU into daily channel-location series can create mostly zeros. Aggregating a fast SKU across Amazon and Shopify can hide a channel shift. Choose the lowest level that still has enough signal to support a decision, then reconcile the result to product-family and company totals.
How Should Ecommerce Teams Measure Forecast Quality?

Forecast quality should be measured with both statistical and operational metrics. Error shows how closely the forecast matched demand, while availability, excess stock, and cash show whether the process improved the business. A forecast can score well statistically and still fail if it triggers late orders or ties up too much working capital.
Use a Forecast Control Panel with five metric groups:
- Accuracy: MAE, WAPE, or MASE at SKU and portfolio level
- Bias: Cumulative tendency to overforecast or underforecast
- Availability: In-stock rate, stockout days, and fill rate
- Inventory health: Weeks of supply, aged stock, sell-through, and excess inventory value
- Economics: Lost-sales proxy, expedite cost, markdown cost, and cash tied up
WAPE is calculated as total absolute forecast error divided by total actual units. It is useful for a portfolio because high-volume SKUs receive appropriate weight, but it can still hide whether errors are consistently high or low. Bias must therefore be reported beside accuracy.
Review metrics at the same horizon used for purchasing. A seven-day forecast score does not validate a 90-day supplier commitment. Long-lead products should be evaluated at the lead-time horizon because that is when the original decision had to be made.
Attribution metrics belong in the event layer, not the baseline score. Amazon Attribution units sold can help recalibrate future Amazon influencer campaigns, while Shopify links, discount codes, and analytics can inform future Shopify influencer marketing assumptions. Treat the Amazon Brand Referral Bonus as a profitability adjustment rather than additional unit demand.
Do not treat correlation as proof of causation. Report baseline demand, tagged event sales, total observed demand, inventory availability, and the scenario assumptions together. This makes it easier to learn from campaigns without claiming that every sales movement came from one channel.
Common Inventory Forecasting Mistakes
Most forecast failures come from process design rather than advanced mathematics.
- Using revenue instead of units: Revenue changes with price and mix, while purchase orders require quantities.
- Training on stockout zeros: This teaches the model that constrained sales represent weak demand.
- Averaging away promotions: A moving average can spread a one-time event into future periods.
- Double-counting lift: Planned event demand and safety stock should solve different problems.
- Ignoring reserved stock: Samples, replacements, wholesale allocations, and creator units reduce sellable inventory.
- Using quoted lead time: Actual order-to-sellable time should include delay and receiving history.
- Measuring only accuracy: A lower error percentage has limited value if stockouts or excess inventory rise.
- Overriding without records: Planner judgment cannot improve if changes are not compared with the baseline.
- Scaling traffic before stock is ready: The Amazon traffic planning guide is most useful when demand generation and inventory readiness share one calendar.
- Buying software before fixing data: Automation can accelerate bad assumptions as easily as good ones.
Build a Forecast That Can Survive Growth
The Baseline-to-Buy Forecasting Framework works best as an operating rhythm, not a one-time spreadsheet. Start with clean unit history, correct constrained periods, build a simple baseline, add known events, create scenarios, and translate the result into a reorder decision. Then judge the process by both forecast error and business outcomes.
For ecommerce teams planning creator activity, product launches, or marketplace expansion, the next step is to place the marketing calendar beside the inventory plan and make every expected demand event visible before the purchase order is approved. A managed product-seeding workflow can support that coordination when creator activation and campaign timing become too complex to track manually.