


Every dollar you put into advertising is a question mark until you know your return on ad spend. For eCommerce sellers running paid campaigns across Amazon, Meta, and beyond, that number is the difference between scaling confidently and burning budget on instinct. This guide breaks down exactly how to calculate, benchmark, and improve your ROAS using a structured framework built for modern DTC brands. Whether you are an Amazon FBA seller trying to connect off-platform spend to storefront sales, or a direct-to-consumer brand juggling multiple ad channels, the principles here will sharpen how you think about advertising efficiency from campaign launch to post-purchase reporting. Start with the fundamentals of influencer-driven traffic to see how organic and paid signals work together before you optimize spend.
Key Takeaways
- Return on ad spend measures how much revenue you generate for every dollar spent on advertising, and a strong ROAS varies by channel, margin, and business model.
- Most eCommerce sellers undercount true ad revenue because they fail to connect off-platform clicks to on-platform conversions, especially on Amazon storefronts.
- Improving ROAS requires optimizing both sides of the equation: lowering cost-per-click and raising average order value or conversion rate simultaneously.
- Amazon Attribution and the Brand Referral Bonus program create a measurable feedback loop that rewards sellers for driving external traffic to their listings.
- A consistent measurement model, not just a target number, is what separates high-growth brands from those stuck in a cycle of trial-and-error ad spend.
What Is Return on Ad Spend, and Why Does the Definition Matter?
Return on ad spend, commonly abbreviated as ROAS, is the revenue generated for every dollar spent on advertising. The basic formula is straightforward: divide total ad revenue by total ad spend. If you spent $1,000 on a campaign and generated $5,000 in revenue directly attributed to that campaign, your ROAS is 5x or 500%.
The definition sounds simple, but most eCommerce sellers make a critical mistake at this stage. They treat all revenue as equal, ignoring the difference between gross revenue and margin-adjusted revenue. A 4x ROAS on a 20% margin product is actually a loss, while a 3x ROAS on a 60% margin product can be highly profitable. This is why benchmarking your ROAS against industry averages without accounting for your own unit economics will steer you wrong almost every time.
Key terms you need to define before setting a ROAS target:
- Gross ROAS: Total ad revenue divided by total ad spend, with no margin adjustment.
- Net ROAS: Revenue minus cost of goods sold, divided by total ad spend. Reflects true profitability.
- Blended ROAS: All revenue across all channels divided by all ad spend, regardless of attribution source.
- Target ROAS (tROAS): The minimum ROAS at which your business remains profitable, calculated from your margin structure.
- Marginal ROAS: The incremental revenue gained from the last dollar spent, useful for scaling decisions.
Understanding which version of ROAS you are looking at changes every optimization decision you make. Learn how micro-influencer campaigns affect blended ROAS to see why organic-assisted attribution can inflate or deflate your paid performance numbers.
How Does Channel Mix Change Your ROAS Expectations?
Not all advertising channels produce the same return, and expecting uniform ROAS across paid search, social, and Amazon Sponsored Ads is a setup for chronic disappointment. According to WordStream's industry benchmarks, average ROAS for Google Ads across industries sits around 200%, but top-performing eCommerce accounts regularly achieve 400% to 800% by tightly controlling audience targeting and landing page quality.
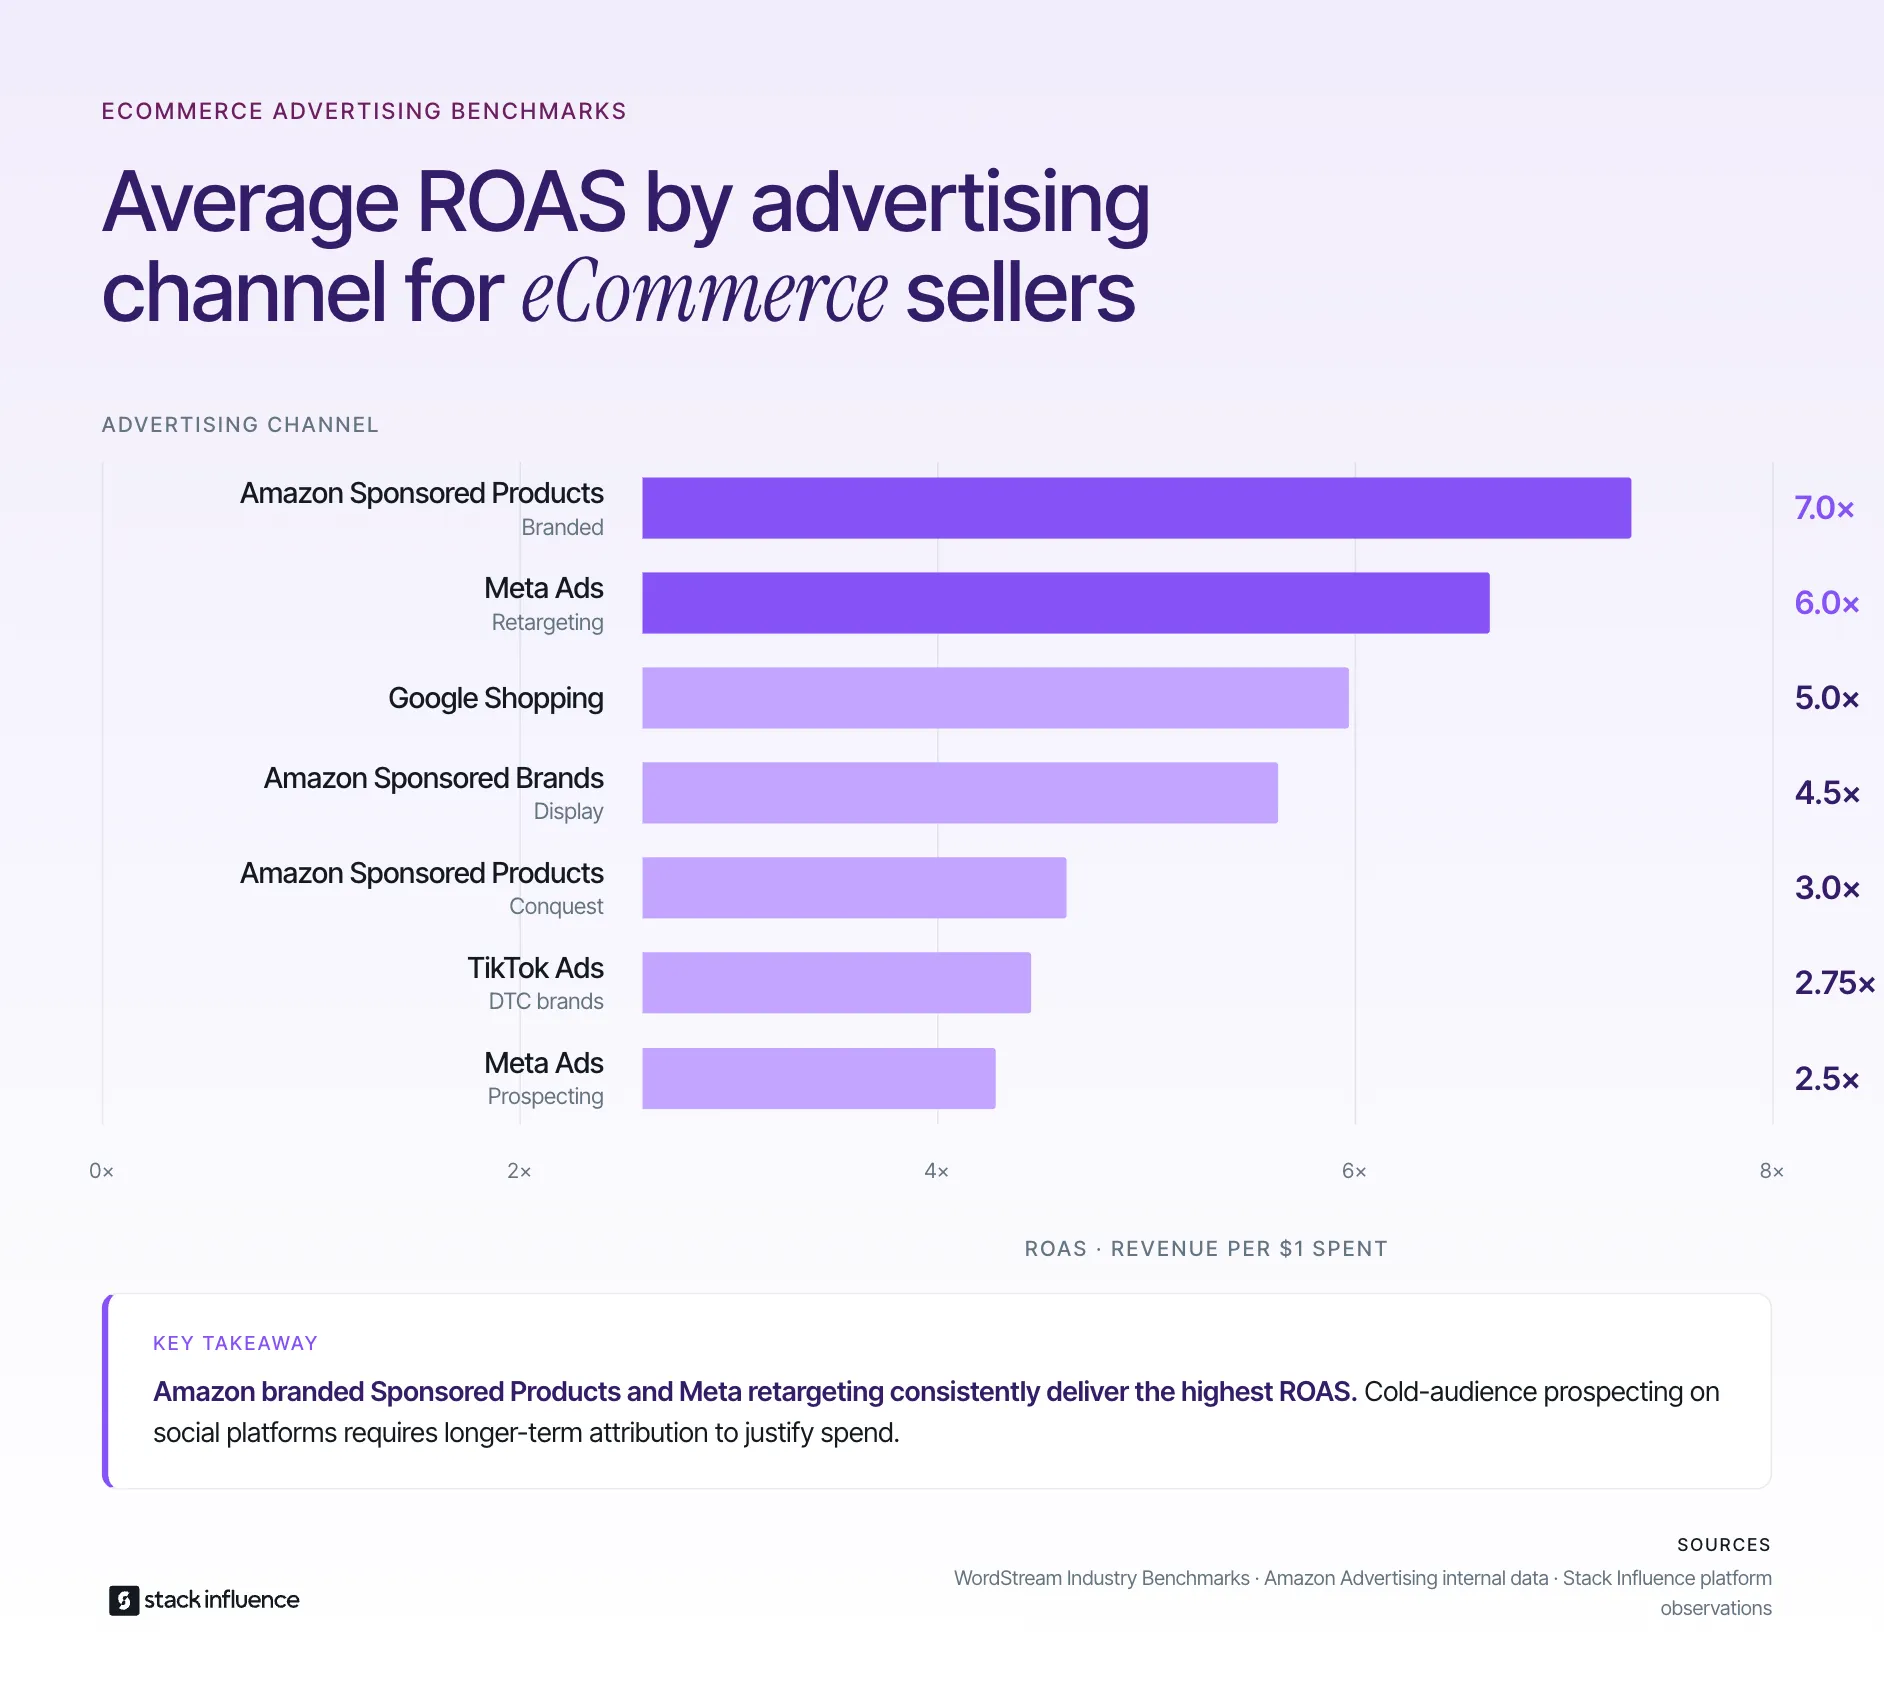
Amazon Sponsored Products typically deliver higher ROAS than off-platform paid social because the buyer intent is already present. A shopper searching for "stainless steel water bottle 32oz" is far closer to purchasing than someone passively scrolling a social feed. This intent gap explains why Amazon FBA sellers often report ROAS in the 4x to 8x range on branded Sponsored Product campaigns, while prospecting campaigns on Meta may sit at 1.5x to 3x.
Channel-level ROAS benchmarks to use as a starting point:
- Amazon Sponsored Products (branded): 5x to 9x
- Amazon Sponsored Products (conquest/competitor): 2x to 4x
- Amazon Sponsored Brands / Display: 3x to 6x
- Google Shopping: 3x to 7x
- Meta Ads (retargeting): 4x to 8x
- Meta Ads (prospecting/cold): 1.5x to 3.5x
- TikTok Ads (DTC brands): 1.5x to 4x depending on product category
These ranges should serve as directional guides, not hard targets. Your actual benchmark depends on your average order value, product category, and how tightly you have built your conversion funnel.
The SPEND Checklist: A Structured Framework for ROAS Optimization
The most reliable way to consistently improve return on ad spend is to apply a systematic checklist before, during, and after every campaign. This framework is called the SPEND Checklist, and it covers the five dimensions that collectively determine whether your ad dollars are working hard enough.
The SPEND Checklist stands for: Segmentation, Pricing alignment, Entry point quality, Nurture pathway, and Data verification. Each dimension represents a category of decisions that directly affects how much revenue each ad dollar returns. Running through this checklist at campaign launch and at every optimization interval prevents the most common ROAS killers from going undetected.
Here is how to apply the SPEND Checklist in practice:
- Segmentation: Are you targeting audiences with purchase intent, or mixing cold and warm audiences in the same ad set? Separation sharpens attribution and improves ROAS calculation accuracy.
- Pricing alignment: Is your advertised price competitive with comparable listings? On Amazon storefronts, even a $2 gap against a competitor can reduce conversion rate by 10% to 15%.
- Entry point quality: Is the landing page, product detail page, or storefront optimized for conversion? A poor entry point is the fastest way to destroy an otherwise healthy ROAS.
- Nurture pathway: Do you have retargeting campaigns, email flows, or follow-up sequences that capture revenue from users who did not convert on the first click?
- Data verification: Are your attribution windows, conversion events, and pixel configurations set up correctly? Bad data produces inflated or deflated ROAS that leads to wrong optimization decisions.
Apply the SPEND Checklist at these three moments: before a campaign launches, at the 7-day performance review, and at the 30-day optimization cycle. Each pass should result in at least one specific action taken on each dimension. See how product seeding campaigns plug into the nurture pathway step to understand how non-paid touchpoints influence paid ROAS.
Stack Influence's internal campaign data shows that eCommerce brands applying a structured pre-launch checklist before activating paid spend see ROAS improvements of 20% to 35% within the first 30 days compared to brands that launch without a documented optimization protocol.
Measuring Return on Ad Spend Across Amazon: The Attribution Stack

For Amazon sellers specifically, measuring return on ad spend requires layering three distinct tools that most sellers use independently but rarely connect into a unified view. The result of disconnected measurement is chronically underreported off-platform ROAS and misallocated budgets that pull money from your highest-performing channels.
The three-layer attribution stack for Amazon sellers works like this. First, Amazon Attribution tags allow you to track off-platform traffic sources including Google, Meta, email, and influencer links directly to product detail page views, add-to-carts, and purchases on your Amazon storefront. According to Amazon's own advertising documentation, sellers using Amazon Attribution report a clearer picture of which external channels actually drive incremental sales versus cannibalizing organic ranking traffic.
Second, the Brand Referral Bonus program rewards sellers who drive external traffic by returning 10% of sales as a credit against future Amazon advertising fees. This means every dollar of off-platform ad spend that converts on Amazon is effectively 10% cheaper in net terms, which directly improves your true ROAS calculation when factored in correctly. Most sellers ignore this credit when calculating ROAS, which causes them to undervalue their off-platform campaigns.
Third, post-purchase attribution through tools like TripleWhale or Northbeam fills the gaps left by platform-reported attribution by using first-party data signals to reconstruct customer journeys across touchpoints. This is particularly important for DTC brands running both Amazon and direct-to-website campaigns simultaneously.
Metrics to track within this attribution stack:
- Detail Page View Rate (DPVR): Percentage of ad clicks that result in product page views on Amazon.
- Add-to-Cart Rate (ATCR): Percentage of DPVR visits that convert to cart additions.
- Purchase Rate: The end conversion metric that feeds your ROAS numerator.
- New-to-Brand Percentage: Critical for understanding whether ad spend is acquiring new customers or repurchasing existing ones.
- Brand Referral Bonus credit: Must be subtracted from net ad spend when calculating true ROAS.
Across campaigns managed on the Stack Influence platform, brands that connected Amazon Attribution tags to influencer-driven traffic sources reported 28% higher attributed ROAS compared to the same campaigns measured using only Amazon Seller Central's built-in reporting tools. That gap represents revenue being earned but not credited to the correct channel.
Explore how Amazon Attribution connects to influencer traffic campaigns to see a practical walkthrough of tag setup and conversion tracking.
What Most Guides Get Wrong About ROAS Optimization
Most ROAS optimization content focuses almost entirely on reducing cost-per-click. Lower CPCs feel like an obvious lever: spend less per click, generate the same revenue, ROAS goes up. The problem is that obsessing over CPC reduction often leads to audience narrowing, bid cutting, and creative frequency caps that collectively shrink your reach and cap your revenue ceiling.
The underrated side of the ROAS equation is the revenue numerator, not the spend denominator. Sellers who raise average order value through product bundling, upsells, or subscription models can improve ROAS dramatically without touching their ad spend at all. A product that converts at $40 AOV versus $65 AOV on the same $10 cost-per-click produces ROAS of 4x versus 6.5x respectively, with zero changes to the ad account.
Tactics that improve ROAS through revenue expansion rather than cost cutting:
- Bundling: Combine complementary products into a single SKU that raises AOV while maintaining the same CPC from the original product keyword targeting.
- Post-click upsell sequences: Use email or DTC checkout pages to add incremental revenue that gets credited back to the original ad attribution window.
- Subscription or Subscribe-and-Save enrollment: Recurring revenue from a single acquisition dramatically improves lifetime ROAS even when the first-order ROAS looks modest.
- Social proof loading: More reviews, ratings, and UGC content on your Amazon listing or DTC product page directly increases conversion rate, which raises ROAS without a single bid change.
- Off-Amazon landing pages: For DTC brands, routing ad traffic to an optimized landing page rather than a generic homepage can improve conversion rates by 30% to 50%, according to Unbounce's Conversion Benchmark Report.
Based on Stack Influence's work with eCommerce brands running UGC and product seeding campaigns, product listings enriched with authentic micro-influencer content showed conversion rate lifts between 15% and 40%, which translated directly into ROAS improvements of 1x to 2x multiplier on concurrent paid campaigns targeting the same product pages.
See why UGC content is a conversion rate lever for paid campaigns to understand how pre-click trust signals reduce bounce rates and increase purchase probability.
How Do You Scale Campaigns Without Destroying ROAS?
Scaling ad spend is where most eCommerce sellers experience their most frustrating ROAS declines. A campaign performing at 6x ROAS at $500 per month often drops to 3x ROAS when budget doubles, leading sellers to conclude the channel is saturated. In most cases, the problem is not channel saturation but scaling methodology.
The most common scaling error is horizontal budget increase without vertical audience or creative expansion. When you simply increase daily budgets on a winning campaign without adding new audiences, creatives, or offer variations, the algorithm burns through your warm audience pool faster, begins serving ads to increasingly unqualified users, and drives CPCs higher as it moves into more competitive inventory. ROAS drops predictably.
A structured scaling sequence using the SPEND Checklist framework:
- Validate that your current ROAS is measured accurately using the three-layer attribution stack before scaling any budget.
- Expand audiences horizontally by adding lookalike tiers, interest expansions, or new keyword match types before increasing budget within existing ad sets.
- Introduce new creative variations (at minimum 2 to 3 per ad set) to prevent frequency fatigue before scaling impression volume.
- Scale budgets in 20% increments maximum per week, not 50% to 100% jumps that destabilize algorithm learning phases.
- Re-run the full SPEND Checklist at each new budget tier to identify which dimension is creating friction before attributing decline to channel performance.
Read the full breakdown on scaling influencer and paid hybrid campaigns to see how brands layer organic and paid strategies during budget expansion without sacrificing ROAS. The scaling sequence applies across Amazon Sponsored Ads, Meta, and Google Shopping with minor platform-specific adjustments.
Building a Sustainable ROAS Measurement Cadence
A single ROAS number at the end of a month tells you almost nothing actionable. What matters is a consistent measurement cadence that tracks ROAS movement across time, channel, campaign type, and product category simultaneously. This is the difference between reactive budget management and proactive growth planning.
Your measurement cadence should include three reporting horizons: daily performance alerts, weekly optimization reviews, and monthly attribution audits. Daily alerts should flag any campaign where ROAS drops below 80% of its 7-day average, triggering an immediate creative or bid review. Weekly reviews should compare ROAS by channel, by SKU, and by audience segment using the metrics defined in your attribution stack. Monthly attribution audits should reconcile platform-reported ROAS with your post-purchase attribution tool and apply Brand Referral Bonus credits to produce your true net ROAS.
Build your complete eCommerce reporting stack to establish the right measurement infrastructure before you scale. Explore how Amazon FBA sellers structure attribution reviews for a seller-specific framework that integrates Amazon Attribution with Seller Central metrics.
Running this cadence consistently is not glamorous work, but it is the foundational habit that separates eCommerce brands achieving sustained ROAS improvement from those constantly chasing performance spikes that disappear before they can be replicated.
Turning ROAS Insights Into Compounding Growth
Improving return on ad spend is not a one-time optimization project. It is a system that compounds over time as your attribution data improves, your creative library deepens, and your audience understanding sharpens with each campaign cycle. The SPEND Checklist is designed to be run repeatedly, not just at launch, because each iteration adds a layer of precision that raises the floor of your minimum ROAS.
The brands growing fastest in eCommerce are not those with the highest ad budgets. They are the brands that have built measurement systems tight enough to act decisively on performance data within days, not weeks. When you can identify which campaign, which creative, which audience segment, and which product page combination is producing your best ROAS, you can redistribute budget toward that combination with confidence and scale it without guesswork.
Start with your ROAS formula, run it through the attribution stack, apply the SPEND Checklist, and commit to a measurement cadence that gives you real data at every decision point. That sequence, repeated consistently, is the foundation of advertising that pays for itself and compounds into sustainable growth.