



Average order value (AOV) measures how much revenue an order generates on average. Calculate it by dividing revenue by the matching number of orders for a defined period.
For ecommerce sellers, the useful question is how to increase that amount while preserving conversion and the money left after variable costs. A bigger basket can come from a better product combination, a different customer mix, or a costly promotion. Each calls for a different decision.
Key Takeaways
- Calculate AOV with a consistent revenue definition and matching order population. Label refund-adjusted calculations separately from the original order value.
- Use relevant benchmarks as context, then compare your own customer segments and order mix before interpreting a change.
- Test useful bundles, compatible add-ons, meaningful upgrades, and shipping incentives against their full variable costs.
- Evaluate contribution from comparable traffic alongside AOV. Larger orders can still leave less money to cover acquisition and overhead.
How Do You Calculate Average Order Value?

Calculate average order value by dividing the revenue from a defined group of orders by the number of those orders. Keep the dates, currency, sales channel, and inclusion rules consistent.
Average order value = revenue from included orders ÷ number of included orders
For an illustrative example, suppose your store records $36,000 in merchandise revenue after discounts from 600 paid customer orders during a 30-day period. Shipping and taxes are excluded, and there are no later adjustments in this initial calculation.
AOV = $36,000 ÷ 600 = $60 per order
Count orders rather than customers or individual items. One customer placing three orders contributes three orders to the denominator. An order containing three products still contributes one.
Define What Your Revenue Includes
Shopify's Sales reports definition of average order value uses original product revenue after discounts, excluding taxes, shipping, and subsequent order adjustments such as returns. Check the definition of the specific report you use before comparing its number with another dashboard.
For your own operating analysis, document which order statuses qualify. A view restricted to paid customer orders can differ from a platform's default reporting. When working from line-item exports, deduplicate by order ID so multiple products do not inflate the denominator.
Track later refunds with a separate, clearly labeled measure. If the same 600 original orders subsequently generate 1,200inmerchandiserefunds,refund-adjustedrevenueperoriginalorderbecomes(36,000 − $1,200) ÷ 600 = $58.
Keep those refunds attached to the original group of orders when evaluating its outcome. Subtracting refunds from older purchases from this week's revenue would answer a different question. Give comparison groups the same opportunity for returns to appear.
What Is a Good Average Order Value?
A good AOV supports your store's economics and matches what customers reasonably need to buy. A universal dollar target cannot account for different catalogs, prices, margins, and purchase frequencies.
For context, Littledata's October 2026 AOV benchmark reports a median store AOV of $108 across 427 qualifying Shopify stores using Littledata, measured from July 13 through October 10, 2026. Category medians ranged from $70 for Beauty & Skincare, based on 38 stores, to $215 for Home & Furniture, based on 62 stores.
Those figures are medians of store-level AOVs, not the median individual order or a representative average for all ecommerce. They are reported in US dollars, but the sample is not identified as US-only. Use them to frame a comparison, not to set a mandatory target.
Start with your own comparable periods and segments: similar products, promotion intensity, countries, channels, and customer types. Review the median order value and common basket combinations as well. A few unusually large orders can lift the mean without describing what most shoppers buy.
Check Whether Customer Mix Explains the Change
An increase in blended AOV can come entirely from a change in which customers place orders. Compare segment results before concluding that an upsell or promotion increased spending within those segments.
Consider two illustrative periods with 1,000 paid orders each. Orders from new customers average $40 in both periods, while orders from returning customers average $80. These groups are mutually exclusive and cover all orders; amounts are merchandise revenue after discounts, excluding tax and shipping, with no later adjustments.
- Period A: 800 new-customer orders generate $32,000, and 200 returning-customer orders generate $16,000. Total revenue is $48,000, producing a blended AOV of $48.
- Period B: 600 new-customer orders generate $24,000, and 400 returning-customer orders generate $32,000. Total revenue is $56,000, producing a blended AOV of $56.
The returning-customer share rises from 20% to 40% of orders. Blended AOV increases by $8, or 16.7%, even though new-customer AOV stays at $40 and returning-customer AOV stays at $80.
Calculate the combined figure as total revenue divided by total orders. Averaging the two segment AOVs equally would produce $60 and misrepresent both periods because the order counts differ.
This change might still be commercially valuable. The point is to identify its mechanism: a different mix of orders, rather than increased average spending within either customer group. Apply the same check when your mix of channels, countries, or product categories changes.
Choose a Basket-Building Tactic That Solves a Buying Problem
Choose the tactic from the purchase decision you want to improve. Make the additional value understandable, then test whether customers choose it at acceptable economics.
Build a Bundle Around One Complete Use Case
A bundle should make a recognizable task easier. A cleaning starter set could combine a reusable bottle with compatible refills; a coffee tasting set could help shoppers compare several varieties.
Calculate the set's selling price after discounts, component costs, packaging, and fulfillment before choosing the offer. Check whether customers who would have purchased every component separately will simply receive a new discount. For replenishable products, compare a multipack with the single-unit option and make the unit pricing clear.
If you use Shopify, its product-bundle documentation explains that creating bundles requires a bundles app. Confirm the chosen setup handles your intended products and inventory before promoting the offer.
Offer a Compatible Add-On or a Meaningful Upgrade
A cross-sell adds a complementary product; an upsell offers a higher-value version of the original choice. Match the recommendation to the item already selected and explain the benefit precisely.
For example, suggest a lid that fits the selected storage container, or explain why a larger capacity would suit a particular use case. Keep optional accessories clearly optional. A shopper should understand what the extra spend buys without opening several comparison pages.
Track how often the addition is purchased, the contribution it adds, and whether the recommendation interferes with checkout. A higher attachment rate is useful only when the full order economics support it.
Price Free Shipping Against Incremental Contribution
Set a shipping threshold using common basket sizes, plausible additions, and the cost of subsidizing delivery. A threshold chosen solely as a percentage above AOV overlooks the economics of the extra items.
Suppose, illustratively, that an extra $12 of merchandise leaves a 50% contribution margin after its incremental variable costs but before a new $5 shipping subsidy. The additional contribution is $12 × 50% − $5 = $1. The basket-level break-even addition is $5 ÷ 50% = $10.
That calculation covers an order that actually adds merchandise. A customer who already qualified without changing the basket could receive the $5 subsidy with no additional revenue. Include those orders, shipping zones, and any conversion change when evaluating the offer.
Baymard's research on reducing cart abandonment identifies late-appearing costs as a checkout problem and recommends showing full costs and shipping eligibility clearly. Make the threshold and exclusions visible before the final checkout step.
Explain Why the Larger Purchase Is Useful
Show the relationship between products through accurate photos, short demonstrations, and clear descriptions. Explain compatibility, quantities, size, and intended use so shoppers can evaluate the larger purchase.
When creators are part of your acquisition strategy, Stack Influence's guide to Shopify AOV and influencer content explains how to connect a demonstrated product combination with its purchase destination. Use that approach to develop a testable offer and brief.
Keep reimbursed campaign-participation orders separate when measuring ordinary customer basket behavior. Content delivery, campaign purchases, and audience purchases answer different questions. An engaging demonstration alone does not establish an increase in AOV.
Compare Offers Using Contribution Per Session
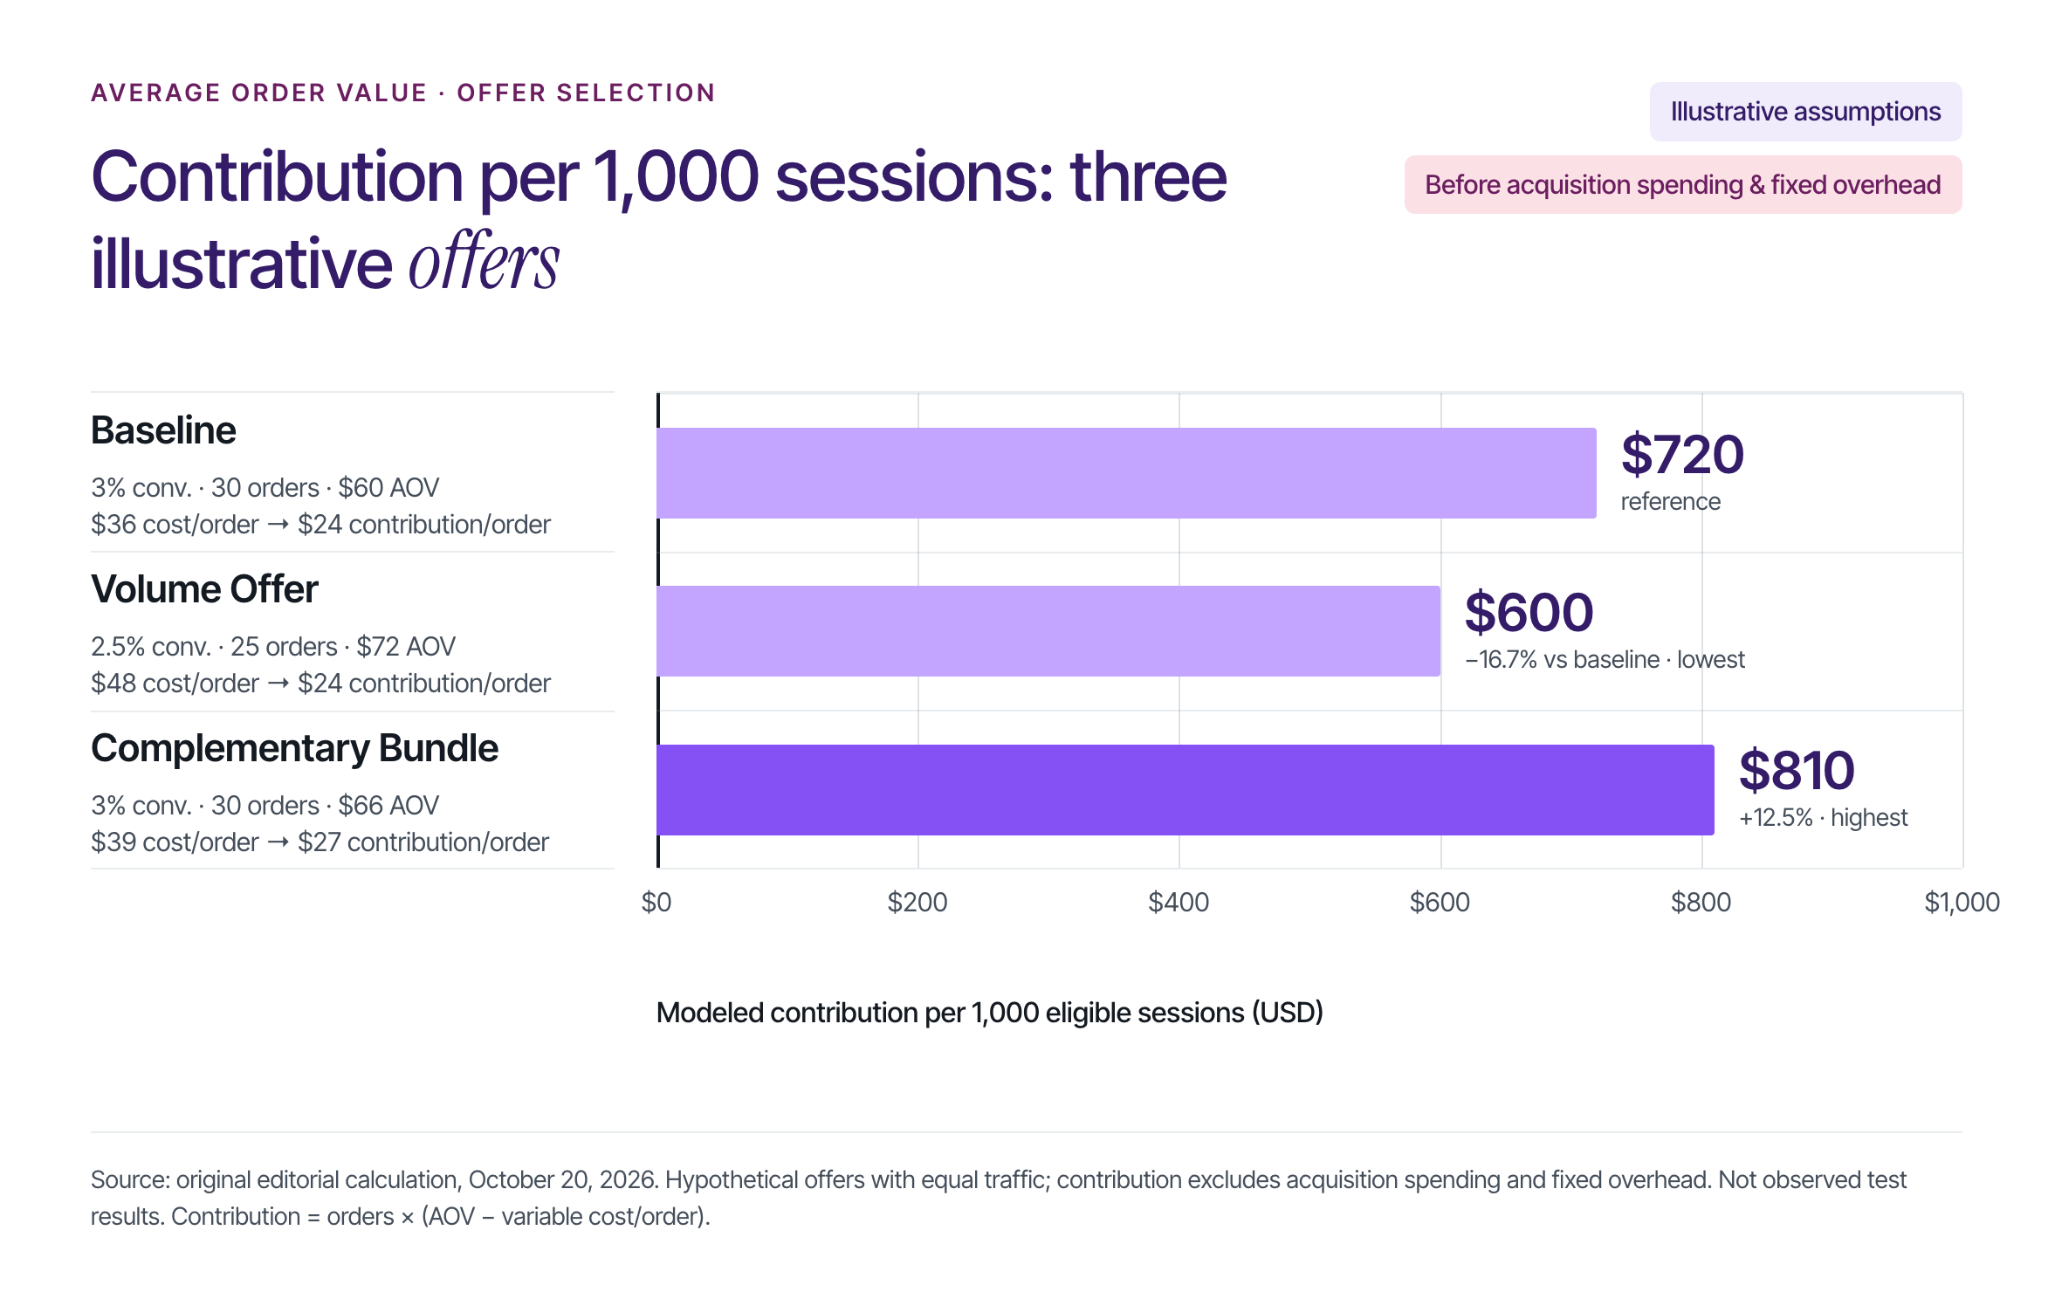
Compare the money each offer leaves after variable costs across the same amount of eligible traffic. This connects basket size with the likelihood of an order and the cost of fulfilling it.
For the following model:
Contribution per order = AOV − average variable cost per order
Contribution per 1,000 sessions = orders per 1,000 sessions × contribution per order
Consider three illustrative offers, each receiving 1,000 eligible sessions. Every converting session creates one order, so the modeled session conversion rate also equals orders divided by sessions. All dollar amounts are hypothetical US dollars, discounts are already reflected in AOV, taxes are excluded, and customer shipping payments are zero.
Variable costs combine merchandise, payment fees, packaging, fulfillment, seller-paid shipping, and an allowance for the net economic effect of returns. Revenue has no later refund deduction, so that return allowance is counted once. Acquisition spending is assumed equal across offers and excluded, along with fixed overhead.
- Baseline: AOV is $60, conversion is 3%, and variable cost is $36 per order. The 30 orders generate $1,800 in revenue and $720 in contribution, or $24 per order.
- Volume offer: AOV is $72, conversion is 2.5%, and variable cost is $48 per order. The 25 orders generate $1,800 in revenue and $600 in contribution, or $24 per order.
- Complementary bundle: AOV is $66, conversion is 3%, and variable cost is $39 per order. The 30 orders generate $1,980 in revenue and $810 in contribution, or $27 per order.
The volume offer raises AOV by 20% while reducing contribution per 1,000 sessions by 16.7%. The bundle raises AOV by 10% and contribution by 12.5%. These are assumed scenarios that demonstrate the calculation, not forecasts of how either tactic will perform.
The amounts shown are contribution before acquisition spending and overhead, rather than net profit. Include customer acquisition cost in the broader decision, especially when an offer requires additional media or creator spending.
Run an AOV Test You Can Interpret
Define the test before launching the offer so the result answers a specific business question. Use the following sequence:
- Select a comparable audience and product group. Record the current AOV, order rate, variable costs, and refund treatment.
- Change one offer. Specify the extra product, upgrade, or incentive and why a customer would value it.
- Where practical, randomly assign eligible visitors to the current offer or one variant, keeping each visitor's assignment consistent. Record other promotions, stock changes, and tracking issues.
- Compare AOV, order rates, and contribution per eligible session. Examine important segments and allow comparable time for returns.
- Keep, revise, or stop the offer based on the contribution change, customer experience, and uncertainty in the evidence.
The 1,000-session examples above are a convenient comparison scale, not a recommended sample size. Plan the observation period and sample around your traffic, variability, and the improvement that would matter commercially. A short fluctuation does not establish a reliable winner.
If basket value rises while fewer shoppers finish buying, use the Shopify conversion troubleshooting guide to investigate where the purchase journey changed. Check the offer's explanation, compatibility, total cost, and checkout experience before adding another incentive.
Start With One Measurable Improvement
Calculate a consistent baseline, check the customer mix behind it, and choose one useful addition or upgrade to test. Record the full variable costs before launch, then evaluate contribution across comparable traffic. That process turns average order value into a practical decision tool for building more valuable orders.