


Marketplace fees almost never damage margin through one obvious charge. They erode it through stacked percentages, fulfillment rules, return handling, software costs, and the rising cost of buying traffic on channels you do not control. For eCommerce sellers, that means learning how to evaluate marketplace fees is less about memorizing fee schedules and more about understanding true contribution margin by channel.
The pressure is real. Marketplace Pulse reports that 49% of Amazon sellers identify marketplace fees as their primary margin concern, nearly matched by 46% who cite advertising spend, which means sellers are being squeezed by both distribution cost and demand cost at the same time. This guide will show you how to compare headline platform fees, hidden operational costs, and recovery levers like Amazon Attribution and the Brand Referral Bonus so you can make better channel decisions for Amazon, Shopify, and other marketplaces.
Key Takeaways
- The cheapest marketplace is not always the most profitable one because referral fees, fulfillment, returns, software, and acquisition costs stack differently by channel.
- Sellers should compare marketplaces with a contribution-margin model, not a single fee percentage.
- Amazon sellers need to measure both cost and recovery, especially when Amazon Attribution and Brand Referral Bonus can offset part of referral drag.
- Content assets matter in fee evaluation because UGC can improve conversion on Amazon, Shopify, and your Amazon storefront long after the first click.
2026 Marketplace Cost Pressure for Sellers

Fee evaluation matters more in 2026 because marketplaces keep adding cost in layers, not in one clean line item. Amazon announced that U.S. FBA fees would rise by an average of $0.08 per unit in 2026, and its help documentation says a 3.5% fuel and logistics-related surcharge began applying to FBA fulfillment fees on April 17, 2026. That means even sellers who already understand referral fees can still miss margin compression when fulfillment math changes mid-year. Amazon’s 2026 fee update and the official FBA fulfillment fee page make clear that fee monitoring must be ongoing rather than annual.
Here is the practical implication for eCommerce teams managing multiple channels:
- Headline fee rates are only the opening number. A 15% referral fee can look manageable until storage, surcharges, returns, and ad spend make the effective take rate much higher.
- Thresholds change the economics of the same SKU. Category assignment, sale price, dimensional weight, and low-price tiers can materially change per-order profitability.
- Channel fees and channel demand costs interact. A lower referral fee on one marketplace does not help if you must buy more traffic to move the same inventory.
- Static calculators age fast. Official fee pages, surcharge notices, and policy changes can make last quarter’s margin model misleading.
Most sellers already know they pay to access demand. What they miss is that each marketplace charges for demand differently. Amazon often blends referral, fulfillment, inventory, and ad dependence. Shopify shifts more of the burden into merchant-controlled software, payment, and acquisition costs. Walmart, eBay, and Etsy each come with their own fee logic, which is why a fee evaluation method has to travel across channels instead of staying Amazon-only.
What Is Marketplace Fee Evaluation?
Marketplace fee evaluation is the process of turning every channel cost tied to one sale into a single contribution-margin view. It is not the same as checking a referral percentage, because a real fee decision includes platform take rate, order execution cost, payment cost, traffic cost, return exposure, and any recovery mechanism that gives margin back.
A useful fee evaluation model includes five inputs:
- Platform take rate. Amazon referral fees vary by category, Walmart referral fees range by category from 6% to 15% in many common cases, eBay’s basic fees for most categories start at 13.6%, and Etsy charges a 6.5% transaction fee plus listing fees.
- Execution cost. Fulfillment, storage, inbound placement, packaging prep, and return handling can change the economics of the same item even when the platform fee stays flat.
- Merchant infrastructure. A DTC stack can avoid marketplace referral fees but still carry payment, app, and operational expenses, especially when Shopify’s pricing page notes third-party transaction fees of 2% on Basic, 1% on Grow, and 0.6% on Advanced when outside payment providers are used.
- Demand generation cost. Sponsored ads, affiliate commissions, creator fees, and couponing often matter as much as the platform fee itself.
- Recovery levers. Brand Referral Bonus credits, price thresholds, and reusable content can offset part of apparent fee burden when measured correctly.
If your team is still mapping channel structure, Stack Influence’s How to Become an Amazon Seller in 2026 and How to Set Up a Shopify Store are useful internal primers because they frame Amazon and Shopify as operating models, not just storefront choices. That distinction matters because the fee line belongs to the operating model, not just the sales channel.
Where Sellers Lose Margin Before They Notice
Margin usually disappears in the gaps between fee categories. Sellers who price from a headline referral rate often miss the impact of return handling, aged inventory, dimensional changes, or the operational labor it takes to keep listings, shipments, and marketing synced. Amazon’s own fee pages and seller-focused breakdowns both show that the risk is cumulative, especially when a product looks healthy on revenue but carries too many cost touchpoints underneath it. Amazon’s selling fee schedule is essential, but it should be read alongside broader cost categories such as storage, adjustment, inbound, and refund-related charges.
The most common blind spots are operational, not financial-theory errors:
- Category mismatch. A listing assigned to the wrong category can quietly push a product into a worse fee tier.
- Threshold shifts. On Amazon, pricing under or over certain thresholds can change fulfillment economics, including the low-price FBA treatment for items under $10.
- Inventory age. Storage and aged-inventory charges turn slow movers into margin leaks even when top-line sales look decent.
- Return friction. Refund administration, restocking, or customer-service costs reduce net proceeds more than many sellers model upfront.
- Hidden labor. Manual creator outreach, spreadsheet tracking, and post-sale cleanup often sit outside the fee model even though they consume real dollars.
That last point is where many DTC brands and Amazon sellers undercount cost. A marketplace may look cheaper on paper, but if your team is manually coordinating UGC, storefront updates, coupon stacks, and creator logistics, labor becomes a shadow fee. Stack Influence has observed that operational overhead is often the hidden variable in these programs, which is why sellers evaluating new campaigns should treat workflow effort as part of channel cost rather than free internal capacity.
For teams trying to avoid that gap, Stack Influence’s Automated Product Seeding workflow and its Micro-Influencers & UGC in E-Commerce guide are relevant because they frame creator logistics and content reuse as cost controls, not just marketing extras. That is a smarter lens for fee evaluation than looking at platform percentages alone.
The Margin Ladder for Fee Decisions
The best way to compare channels is to stop asking, “What is the fee?” and start asking, “Which layer of cost am I looking at?” The Margin Ladder is a four-tier model for doing exactly that. It helps eCommerce sellers move from shallow platform math to full contribution-margin math without getting lost in one giant spreadsheet.
Use the Margin Ladder in this order:
- Posted Fee. This is the public number sellers usually compare first, such as Amazon referral rates, Walmart referral percentages, eBay final value fees, or Etsy transaction and listing fees.
- Landed Fee. This adds fulfillment, storage, inbound, prep, and return costs, which is where many Amazon and Walmart calculations change materially.
- Blended Fee. This includes ad spend, software, payment processing, creator costs, promotions, and team labor across the full order journey.
- Strategic Fee. This is the net cost after bonuses, reusable content, conversion lift, and repeat-purchase or retention effects are counted.
The Margin Ladder is useful because it explains why a lower-fee channel can still produce worse economics. A $25 item on Amazon may face category-specific referral costs and FBA handling, but it also sits inside a marketplace with enormous purchase intent. A Shopify order may avoid referral fees, yet still absorb payment costs, app costs, and paid acquisition. Walmart, eBay, and Etsy can be attractive for certain SKUs, but only if the traffic and operational requirements justify the listed fee advantages.
To make the Margin Ladder executable, use this secondary tool before you approve any new SKU or campaign:
- Price Line. Start with net selling price after discounts and promos.
- Platform Line. Deduct referral, final value, transaction, and listing fees.
- Operations Line. Deduct fulfillment, storage, prep, packaging, and return exposure.
- Demand Line. Deduct ads, affiliates, creator compensation, and internal labor.
- Recovery Line. Add back any bonus credits, reusable asset value, or cross-channel conversion gains.
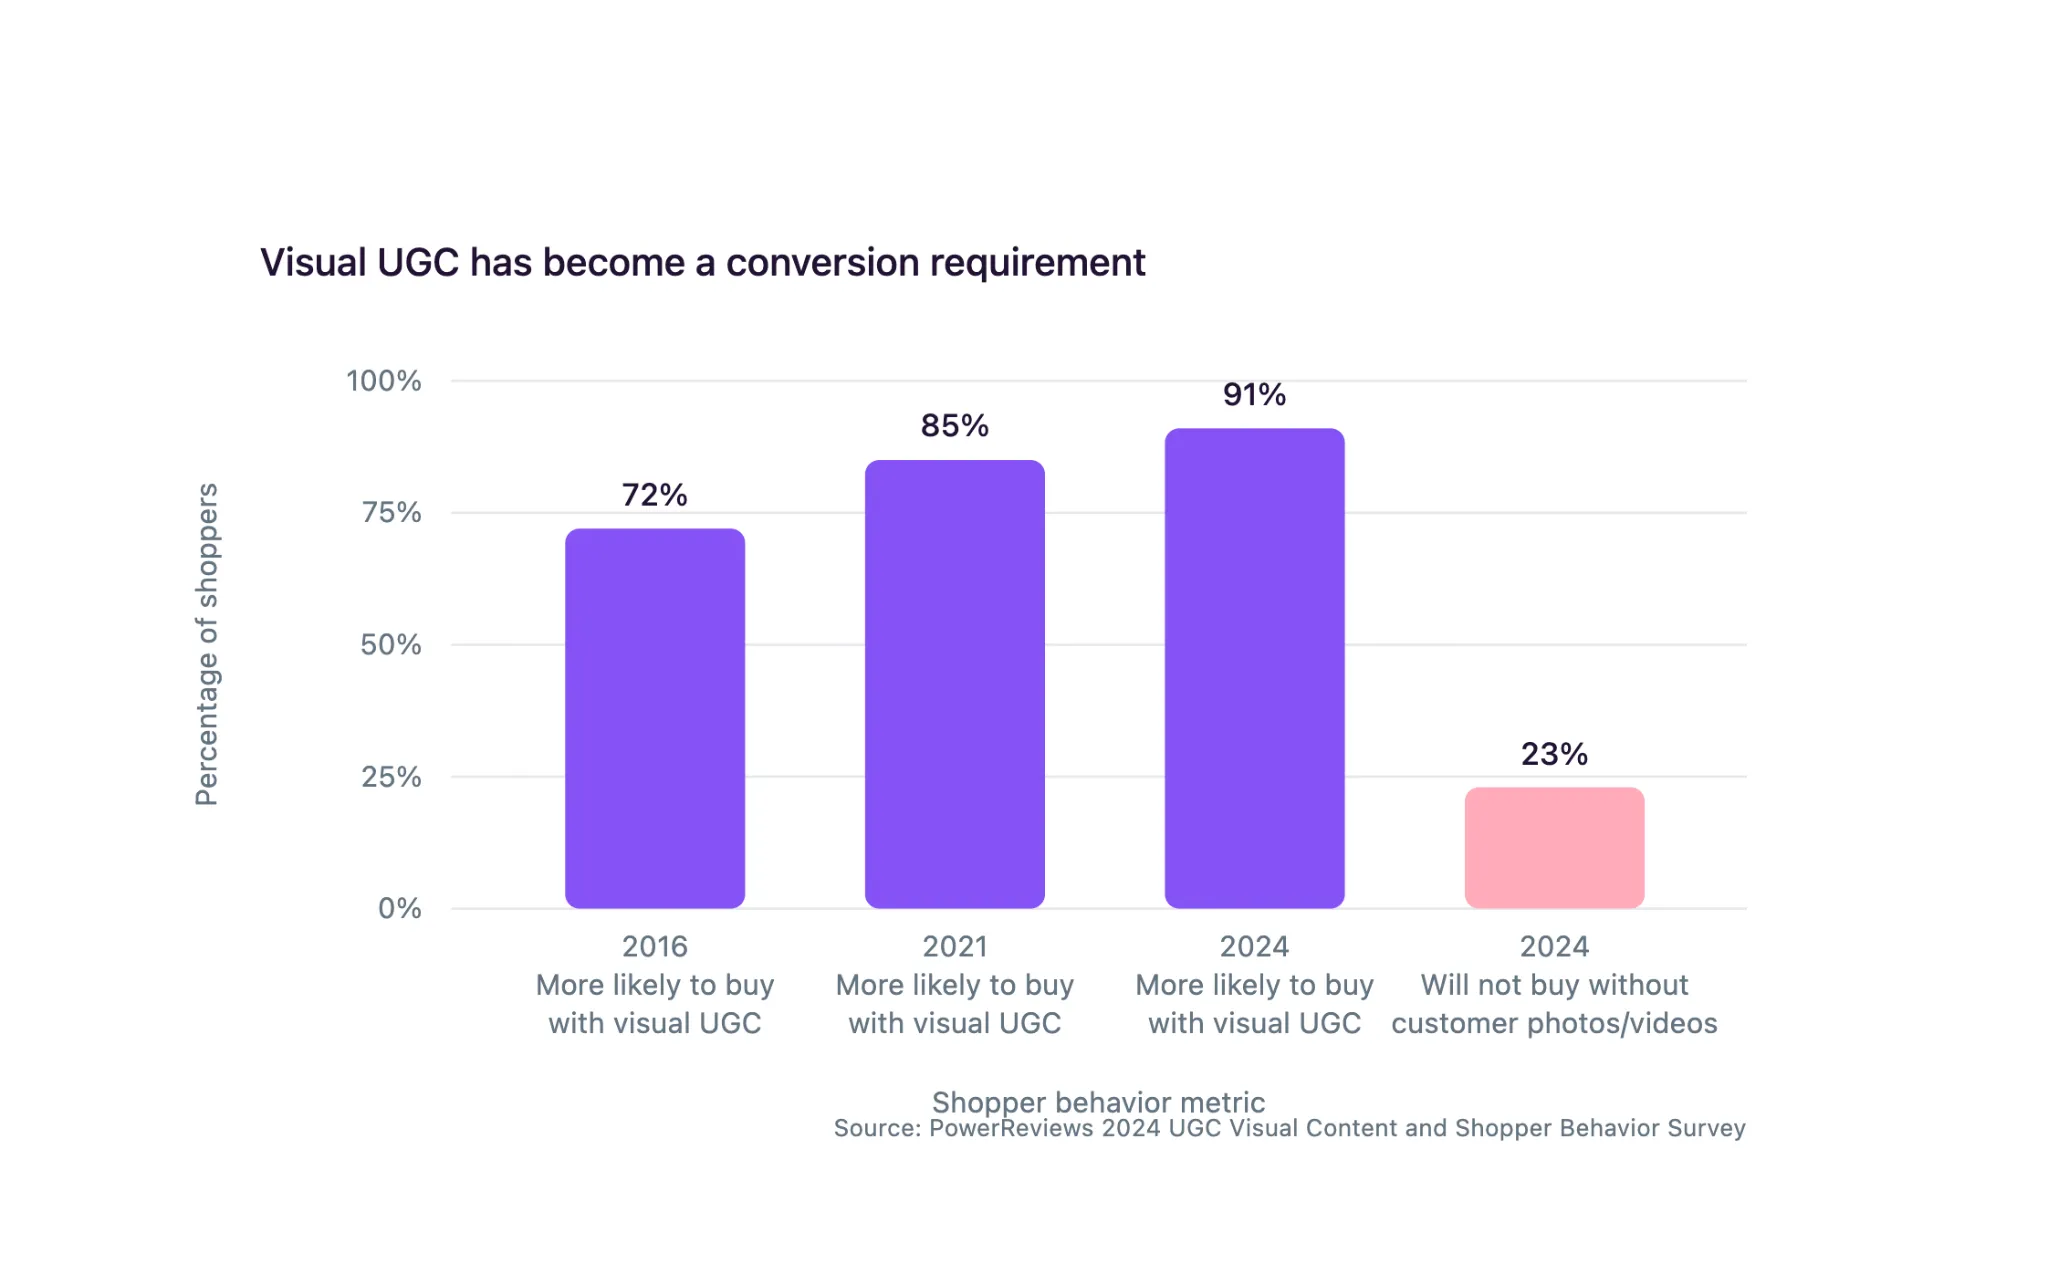
Based on Stack Influence’s work with eCommerce brands, the biggest modeling mistake is treating content as a one-time traffic expense. In practice, one creator asset can support Amazon PDPs, an Amazon storefront, Shopify product pages, and retargeting ads, which means its cost should be amortized across multiple uses, not assigned to one click source. That matters because PowerReviews found that 91% of consumers are more likely to buy when reviews include photos and videos, which turns content quality into a conversion lever, not just a branding bonus.
How Should Sellers Measure Fee Recovery and Channel ROI?
A strong fee model tells you what you paid. A strong measurement model tells you what you got back. For Amazon sellers, the cleanest practical framework is the Signal-to-Sale Stack, which tracks non-Amazon traffic from source click to retail conversion and then to recovered margin. Amazon says Amazon Attribution is a free measurement solution for eligible sellers, vendors, and agencies, and its documentation states that Attribution uses a 14-day last-touch model for conversion credit.
The Signal-to-Sale Stack works best in four layers:
- Traffic Signal. Tag every creator, email, paid social, and search source before launch so you know where sessions came from.
- Retail Engagement. Track product-detail engagement, add-to-cart behavior, and other mid-funnel indicators so you do not kill a profitable source just because it closes slowly.
- Attributed Sales. Measure units, orders, and revenue that Amazon connects back to the tagged source.
- Margin Recovery. Layer in Brand Referral Bonus, which Amazon says averages 10% on qualifying sales driven by external traffic, so you can calculate net margin after bonus recovery rather than before it.
This section is also where Stack Influence fits naturally. Data from Stack Influence’s micro influencer campaigns suggests that campaigns tagged before product ships produce cleaner reporting than campaigns that add tracking after content is already live. That observation aligns with Amazon Attribution’s structure because the tool only helps if the source link exists before traffic starts moving. Teams that want a setup reference can use Stack Influence’s internal Amazon Attribution Guide, its explainer on Amazon Attribution links and the Amazon Brand Referral Program, and its guide on How to Get an Amazon Storefront to connect creator traffic, storefront merchandising, and fee recovery into one reporting workflow.
The off-platform challenge is that not every source closes in the same window or with the same audience intent. Creator campaigns, especially for DTC brands and Amazon sellers, often deliver mixed value: some immediate tracked sales, some later halo demand, and some reusable UGC that lifts conversion on both Amazon and Shopify. That is why the Signal-to-Sale Stack should end with contribution margin, not ROAS alone.
Why Most Marketplace Fee Guides Miss the Real Cost
Most marketplace fee guides miss the real cost because they stop at platform math and ignore the operating system around the sale. They are usually good at listing fee categories, but weak at connecting those fees to traffic quality, asset reuse, and the labor needed to keep the machine running. That gap matters because sellers do not experience fees in isolation. They experience them inside a workflow.
Three things other fee guides often leave out should change the way you evaluate marketplaces:
- Traffic quality is part of fee math. A lower-fee channel with weak buying intent can produce worse contribution margin than a higher-fee channel with stronger conversion.
- Cash-flow timing matters. Surcharges, delayed credits, return seasonality, and ad deduction rules affect how painful a fee feels in real business operations.
- Content value belongs in the model. PowerReviews reports that 23% of shoppers will not buy a product if there are no customer photos or videos, so UGC should be treated as conversion infrastructure, not a nice-to-have.
That last point is especially important for Amazon storefronts, Shopify PDPs, and social commerce campaigns. Stack Influence has observed that when sellers separate “traffic cost” from “content cost,” they often overstate the true burden of marketplace fees because the same creator post keeps working after the first campaign ends. Internal resources like Stack Influence’s Influencer Product Seeding Strategies and Amazon influencer marketing solutions are useful here because they frame product seeding and external traffic as margin tools when the resulting content can be reused across listings, ads, and storefronts.
The strategic takeaway is simple. Sellers should not ask which marketplace has the lowest fee. They should ask which channel gives the highest contribution margin after demand cost, workflow cost, and recovery are modeled honestly. That is the real standard for how to evaluate marketplace fees.
Choose the Channel That Protects Contribution Margin
If you want a repeatable answer to how to evaluate marketplace fees, use a layered system instead of a single percentage. Start with the posted fee, move to landed cost, add your blended demand and operational costs, and then measure what the channel gives back through conversion quality, bonus recovery, and reusable content value.
For eCommerce sellers, the goal is not finding the marketplace with the prettiest fee page. The goal is choosing the channel mix that protects contribution margin, supports scalable growth, and keeps your next inventory decision tied to profit rather than guesswork.