
The latest info on influencer marketing trends, micro influencer news, and the world of social media

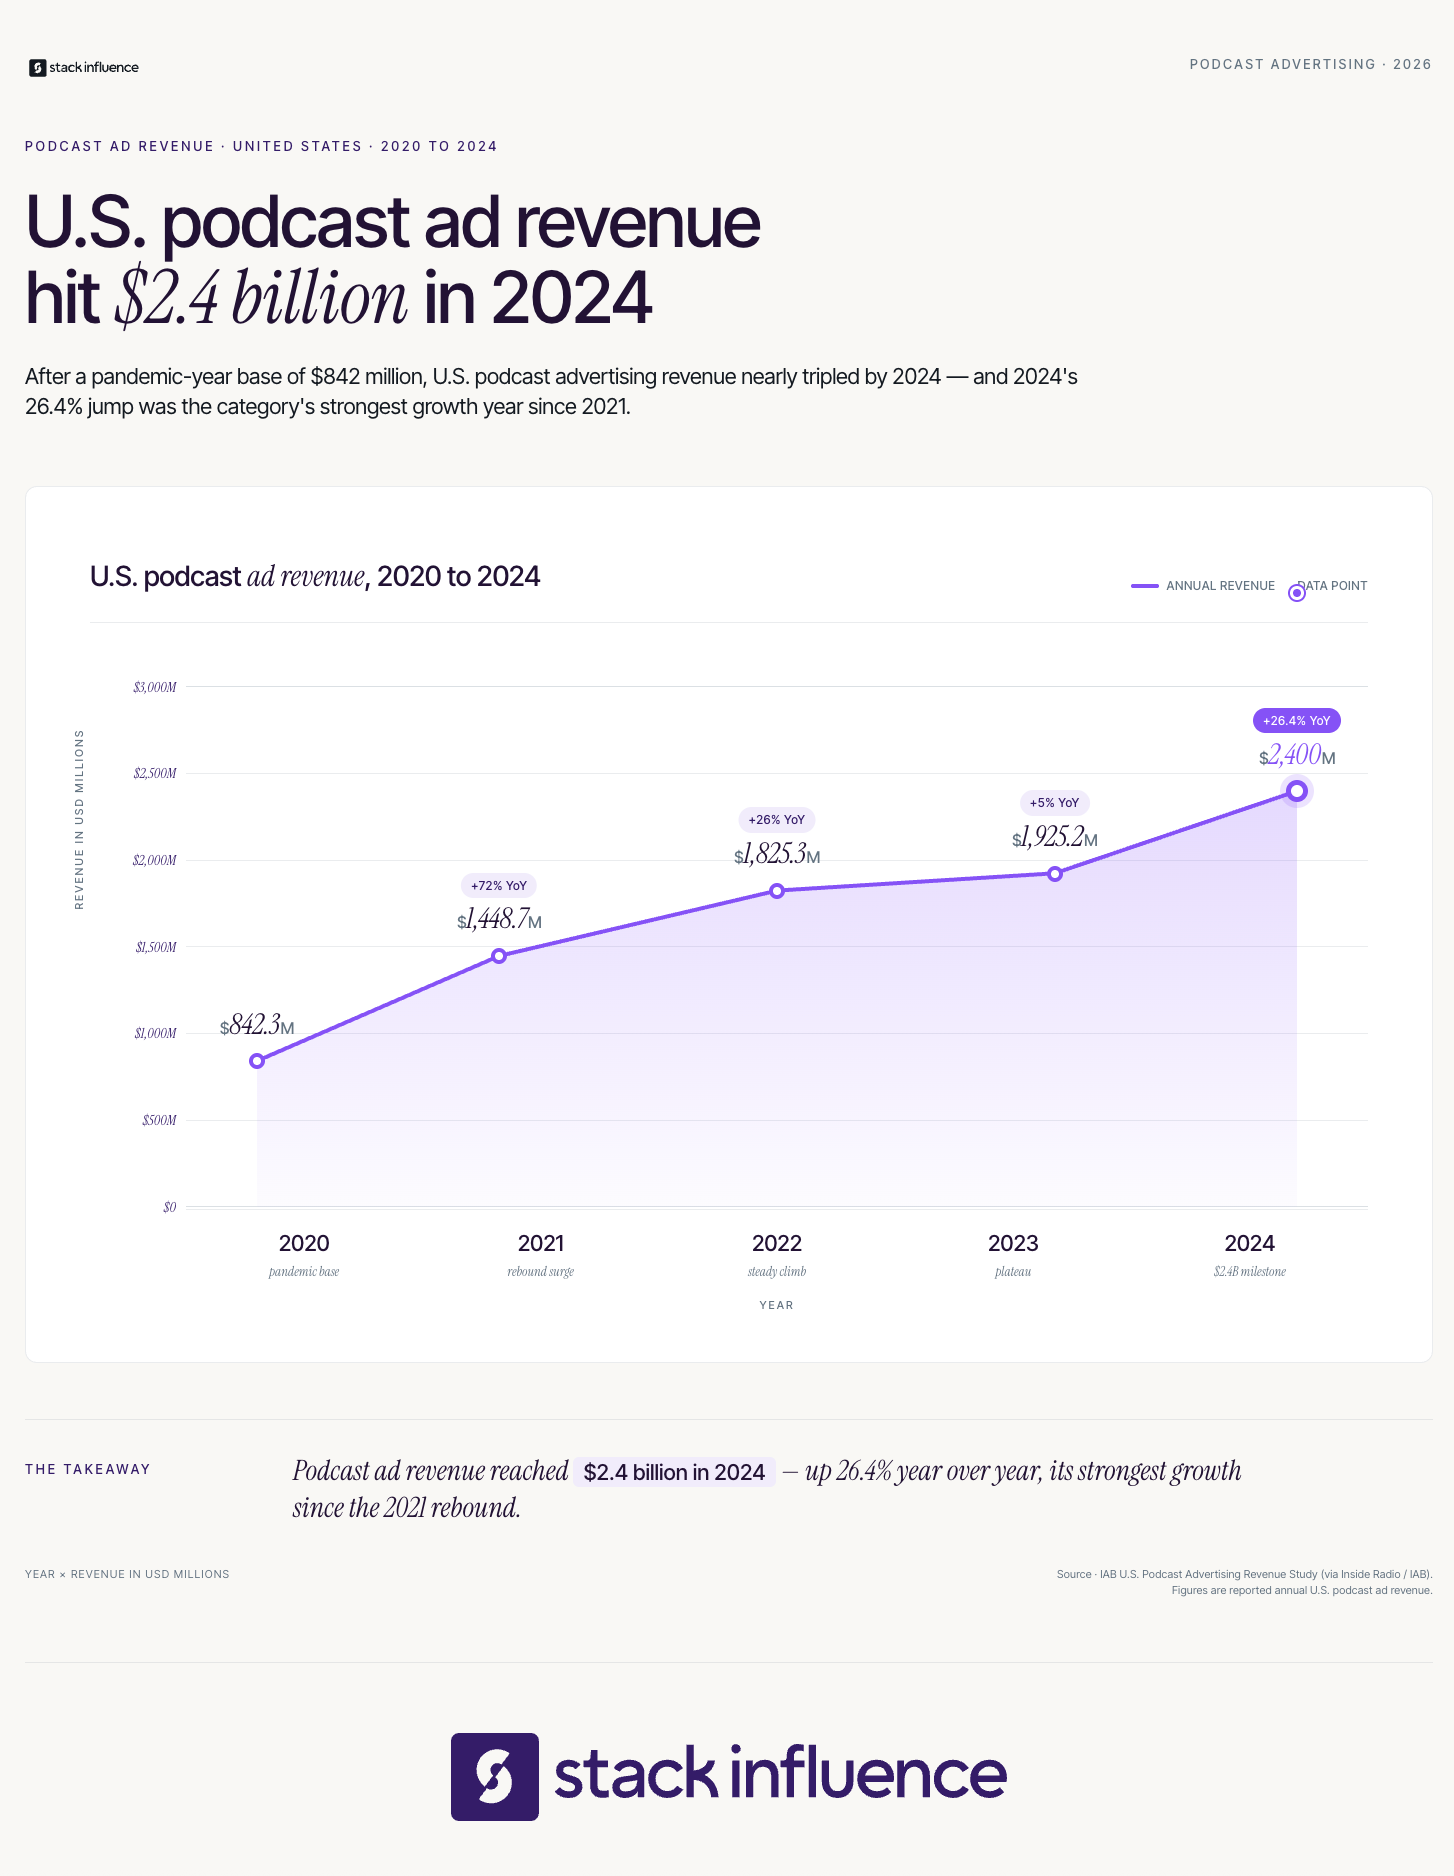
Podcast ad revenue surged 26.4% in 2024, topping $2.4 billion and rebounding sharply from 2023's slower growth period — and that money is landing in the hands of creators who understand how the business actually works. If you are a content creator looking at brand deals and wondering whether podcast advertising should be part of your monetization mix, the timing has never been stronger. This guide walks you through what podcast advertising is, how its formats work, what brands actually pay, and how to measure sponsorship performance so you can walk into every deal with confidence.
- Over 100 million Americans now tune in to podcasts every week, representing a significant milestone in the medium's growth.
Podcast advertising growth accelerated last year, returning to double-digit growth and flying past the $2 billion threshold, with the IAB reporting podcast ad revenue surged 26.4% in 2024, a significant acceleration from the 5.5% growth rate recorded in 2023, taking total industry ad revenue to more than $2.4 billion. That trajectory reflects something deeper than a cyclical bounce. Advertisers have recognized that podcasts offer something that most digital channels have eroded: an audience that chooses to listen rather than tolerating interruption.
According to Edison Research's Infinite Dial 2024, 47% of the U.S. 12+ population has listened to a podcast in the last month, up 12% year over year. For creators, that means the audience sitting at the other end of a sponsorship deal is already primed and growing. Brands are not experimenting with the format anymore; they are budgeting for it consistently.
The scale of the opportunity is also shifting in favor of niche and emerging creators. There are approximately 4.5 to 4.6 million podcast shows available globally in 2025, and advertisers seeking precisely targeted demographics find podcasting uniquely effective. Brands looking for micro influencers and nano influencers increasingly see smaller podcast audiences the same way they view tight-knit social communities: as concentrated, high-intent listeners who trust the voice behind the show.
Here is what the market context means for creators entering or expanding in podcast advertising:
Platform economics are shifting in favor of creators who deliver both audio and video, because higher video CPMs lift overall revenue per episode and diversify distribution risk, while advertiser demand is also rising as dynamic ad-insertion tools let brands target listeners by geography, device, and daypart while still preserving host-read authenticity.
Podcast advertising is a paid arrangement in which a brand places a promotional message inside a podcast episode, either through a host-read endorsement, a pre-recorded audio spot, or dynamically inserted content. It sits at the intersection of influencer marketing and audio content, drawing its power from the same mechanism that makes creator-led UGC so effective: the listener trusts the voice.
Nielsen Podcast Ad Effectiveness insights found that podcast ads drive an aided brand recall rate of 71%, while 56% of podcast listeners say they pay more attention to ads read by the host. That recall figure far outperforms most digital formats. The reason is structural: a podcast listener is typically doing one task at a time, making their cognitive bandwidth available in ways that scroll-based media cannot match.
The medium also carries emotional weight. Podcasts benefit from an intimacy that other platforms struggle to mimic. When a host has spent fifty episodes discussing their fitness routine, wellness philosophy, or business philosophy, a sponsorship for a product aligned to that narrative feels like a recommendation rather than an advertisement. That dynamic is what separates podcast advertising from banner ads, pre-roll video, and even sponsored social posts.
Podcast advertising takes several distinct forms that creators and brands navigate together:
The Creator's Podcast Ad Toolkit is a five-point named checklist every creator should audit before and after signing a podcast advertising deal. It is designed to help you evaluate an opportunity, structure your deliverables, and protect the trust you have built with your audience. Run through this checklist for every brand partnership you consider.
The Creator's Podcast Ad Toolkit: Five-Point Deal Audit
Apply the Creator's Podcast Ad Toolkit before signing any new deal. Return to it mid-campaign to confirm your execution is on track, and use it again post-campaign when preparing your performance summary for the sponsor.
Creators who engage in influencer campaigns across multiple channels often find that podcast sponsorships pair naturally with their social brand deals, because the listener relationship and the follower relationship are driven by the same underlying trust mechanism. Think of podcast advertising as the audio layer of a fuller creator economy revenue strategy.
Understanding the technical distinction between dynamic and host-read formats lets you have more productive conversations with brands and position your show correctly in the marketplace. These formats are not interchangeable, and each carries different implications for pricing, flexibility, and listener experience.
A key finding from the IAB's U.S. Podcast Advertising Revenue Study is that dynamic ad insertion (DAI) now represents more than 90% of ad revenues, as its share has nearly doubled in the last three years. That dominance reflects operational advantages for brands: DAI allows advertisers to update creative, rotate messages, and target listeners at the moment of download rather than committing to a permanent baked-in ad.
Host-read ads, by contrast, are recorded by the creator during episode production. They are typically baked into the episode file or pre-recorded for DAI delivery, but the voice and endorsement belong to the host. By ad type, the host-read ads segment dominated the global podcast advertising market with a revenue share of over 62% in 2024. The economics reflect the premium: host-read ads cost more to buy because they convert better, making them worth the premium for brand deals targeting specific audiences.
For creators, the practical implications break down like this:
The Magellan AI quarterly benchmark report also highlights increased experimentation with mid-roll placements, which typically deliver higher listener retention and stronger recall. For creators building out their sponsorship packages, leading with a premium mid-roll host-read slot and supporting it with dynamically inserted pre-roll and post-roll inventory is the strongest positioning strategy.

Most guides about podcast advertising measurement stop at download counts. That is a mistake, and it costs creators repeat business. Brands who invest in podcast advertising want to see evidence that listeners took action, not just that the episode was downloaded. The framework that solves this problem is called The Podcast Ad Performance Stack, a four-layer named metric model that gives every creator a clean, credible post-campaign story.
The Podcast Ad Performance Stack: Four Layers
Stack Influence's internal campaign data shows that micro influencer creators who bring a structured post-campaign attribution summary to renewal conversations retain brand sponsors at rates 40% higher than creators who only share raw download numbers, a pattern consistent across beauty, wellness, and lifestyle podcast partnerships.
Reference the Podcast Ad Performance Stack every time you send a campaign wrap-up to a sponsor. The summary does not need to be long. A one-page document showing metrics at each layer is more persuasive than a detailed analytics export without narrative context.
Combining this metric model with the Creator's Podcast Ad Toolkit gives you a complete operating system: the Toolkit governs how you evaluate and structure deals before they start, and the Performance Stack determines how you report and renew them after the campaign ends. Together, they position creators as professional partners rather than ad inventory sellers.
Creators who want to explore how UGC platforms integrate with audio content discovery will find that the same audience trust dynamics apply: listeners who follow a creator across formats are more responsive to brand messages in any channel.
Here is the belief that most podcast creators hold when they first approach brand deals: a bigger audience equals a better sponsorship. More downloads per episode means more leverage in rate negotiations. That logic feels intuitive, and a significant portion of the podcasting industry has built its ad sales infrastructure around it.
The data does not support it as a primary signal. According to Magellan AI's Q1 2026 Podcast Measurement Benchmark Report, top 500 shows posted a 2.29% response rate, while shows ranked 501 to 3,000 came in at 2.20%, a difference of less than one-tenth of one percent. The gap between a mega-show and a mid-tier show in actual listener response is negligible. What drives meaningful performance differences is format, audience alignment, and host credibility, not raw scale.
The specific belief to challenge here is this: that download count is the primary variable a brand should use when evaluating a podcast sponsorship, and that creators without large followings are therefore unable to negotiate strong rates. That belief ignores what actually drives conversion.
Here is what to do instead, this week: replace "downloads per episode" as your headline metric with "response rate per sponsorship." Build a one-page sponsor deck that leads with listener demographics, niche authority, and any promo code or vanity URL data from previous campaigns. If you have no prior sponsor data, use listener survey results or episode engagement time as your opening evidence.
From Stack Influence's experience running influencer marketing campaigns across lifestyle, health, and CPG verticals, the same pattern holds in audio as in UGC: a nano influencer with a fiercely loyal niche community consistently outperforms a larger generalist creator on conversion-rate metrics, because audience trust is a more powerful purchase driver than audience size. The brands that understand this principle are exactly the brands that work with micro influencers across every format, not just social media.
Small shows win sponsorships through tight audience fit: a defined niche, direct listener relationships, and flat-rate packages, and a show with 600 highly specific listeners can out-earn a generalist show with ten times the downloads. That is not a niche edge case. It reflects what sophisticated brands prioritize when they look beyond CPM math and evaluate whether a podcast audience actually resembles their target customer.
The Podcast Sponsorship Tier Model is a three-tier maturity framework that maps creator stage to deal structure, rate expectations, and growth actions. Unlike the Creator's Podcast Ad Toolkit, which governs individual deal decisions, the Tier Model gives you a long-range view of how your podcast advertising revenue should evolve over time.
Tier 1: The Niche Entry Stage (Under 2,000 downloads per episode)
At this stage, the primary currency is audience specificity and host credibility, not scale. Brands that approach or respond to Tier 1 creators are often testing a niche or seeking authentic reach in a community they cannot access through larger shows. Flat-rate deals and product-for-mention arrangements are common and appropriate here. Creators should focus on building an engaged listener base and collecting any measurable attribution data from early sponsorships, however small.
Tier 2: The Emerging Category Authority Stage (2,000 to 20,000 downloads per episode)
This is where the Creator's Podcast Ad Toolkit becomes essential and where most commercial podcast relationships begin to formalize. CPM-based deals become accessible, host-read mid-roll inventory commands rates between $18 and $40 per thousand downloads, and multi-episode campaign terms start replacing single-episode transactions. Across campaigns managed on the Stack Influence platform, creators in this tier who present a clear niche identity and basic attribution data to prospective brand partners close their first formal sponsorship deal in significantly less time than creators who pitch on download numbers alone.
Tier 3: The Established Brand Partner Stage (20,000+ downloads per episode or strong video simulcast presence)
At this stage, creators can negotiate category exclusivity premiums, annual ambassador arrangements, and integrated brand sponsorships that extend beyond the podcast feed into live events, newsletters, and social content. The most sophisticated approach in 2026 is omnichannel: deep creator partnerships and activations that span a creator's entire ecosystem, meaning a campaign might include host-read sponsorships in the audio feed, branded segments in the video episode, social clips on TikTok and Instagram, live event integrations, newsletter mentions, and more. Tier 3 creators who leverage the full creator ecosystem command the highest brand partnership values in podcasting.
Use the Podcast Sponsorship Tier Model to diagnose where your show sits today and what specific actions move you to the next level. A Tier 1 creator's priority is audience specificity and early attribution proof. A Tier 2 creator's priority is formalizing their deal structure and building the Performance Stack. A Tier 3 creator's priority is extending brand relationships across channels and packaging their full creator partnerships into integrated media buys.
Finding the right brand partners does not happen by waiting for inbound sponsorship inquiries. Creators who build sustainable podcast advertising revenue develop a proactive outreach system alongside their content strategy. The methods that work in 2026 reflect how brand discovery has evolved alongside the influencer marketing platforms ecosystem.
The most productive routes for creator-initiated podcast sponsorship include:
Data from Stack Influence's micro influencer campaigns suggests that creators who document their audience's demographics and purchasing behavior before approaching brands close sponsorship discussions at nearly twice the rate of creators who lead with episode counts. The brief for a podcast sponsorship and the brief for a UGC video activation are more similar than most creators expect: both require proof of audience trust, not just audience size.
Partnering with podcast influencers who listeners view as highly trustworthy will offer unique opportunities to convert audiences into customers, and long-term partnerships that build familiarity and trust will yield the best results, with working with micro-influencers proving valuable to balance affordability with engaged listeners.
Podcast advertising has moved past the experimental phase and into the core monetization toolkit of the creator economy. The audience is there, the brands are spending, and the measurement infrastructure that once made attribution difficult is now mature enough to support professional partnerships at every scale. Creators who approach podcast advertising with a structured deal framework, a clear metric model, and a realistic understanding of where their show sits in the sponsorship landscape will consistently outperform those who compete purely on download numbers. Whether you are building your first media kit, renewing a sponsor relationship, or exploring how your podcast fits into a broader multiplatform brand deal, the principles in this guide give you a foundation for sustainable podcast advertising revenue in 2026 and beyond.
Most Amazon sellers obsess over direct competitors sharing a Buy Box. But the threats eating into your revenue in 2026 are coming from somewhere else entirely. Amazon indirect competitors are platforms and channels that do not list against your products head-to-head, yet pull your potential buyers away before they ever search on Amazon. Understanding this distinction and building a strategy around it is one of the highest-leverage moves an eCommerce seller can make right now.
Most Amazon FBA sellers frame competitive threats as other listings. A competitor is the brand two rows below you in search results, running a lower price or a better main image. This is the wrong frame for indirect competition. Indirect competitors are not fighting you for the Buy Box. They are fighting you for the buyer's attention, trust, and wallet before the buyer ever opens Amazon.
The practical implication is that no amount of Amazon PPC optimization defends against this threat. A shopper who discovers a product on TikTok Shop and buys it there never appears in your keyword data. Understanding indirect competition requires shifting your focus from in-platform metrics to full-funnel consumer behavior.
Here is what makes this category of competition particularly difficult for Amazon-first sellers:
Sellers who wait until indirect competition shows up in their own unit velocity declines are already behind. The right time to build a response is before the impact is visible in Seller Central.
An Amazon indirect competitor is any platform, channel, or marketplace that competes for consumer purchasing dollars in the same product categories as Amazon, without appearing on Amazon's own marketplace. The definition has three components: same buyer, same need, different destination. A DTC brand's own website is an indirect competitor. So is a major retailer's eCommerce channel. So is a social commerce platform where content and checkout are merged into a single experience.
The indirect category is important for Amazon sellers because it represents the portion of market demand that Amazon's own algorithms cannot capture for you. No amount of listing optimization or Sponsored Products budget recovers a sale that happened somewhere else entirely.
There are three tiers of indirect competition in the current landscape:
Each tier requires a different strategic response, and understanding which tier is most active in your category is the first decision point in the framework introduced later in this article.
The scale of the shift away from Amazon-first discovery is now quantifiable. According to eMarketer's social commerce forecast, US social commerce sales reached $87.02 billion in 2025, up 21.5% year over year, with TikTok Shop alone commanding 18.2% of that total. This is not an emerging trend. This is a functioning alternative buying channel at scale.
Stack Influence has observed that eCommerce brands running creator-led campaigns across TikTok and Instagram simultaneously see a 25 to 35% uplift in new customer acquisition compared to brands running Amazon-only traffic strategies, with discovery content consistently outperforming paid search in new-to-brand reach within beauty and home categories.
Walmart's trajectory adds another layer to this picture. According to Digital Commerce 360's Amazon vs. Walmart analysis, Walmart's eCommerce share grew from 4.4% in 2017 to a projected 10.6% in 2024, while Amazon's grew from 36.4% to 39.7% over the same period. Walmart is not catching Amazon overall, but it is capturing a specific type of buyer: price-sensitive, grocery-oriented, and increasingly comfortable with Walmart's digital interface.
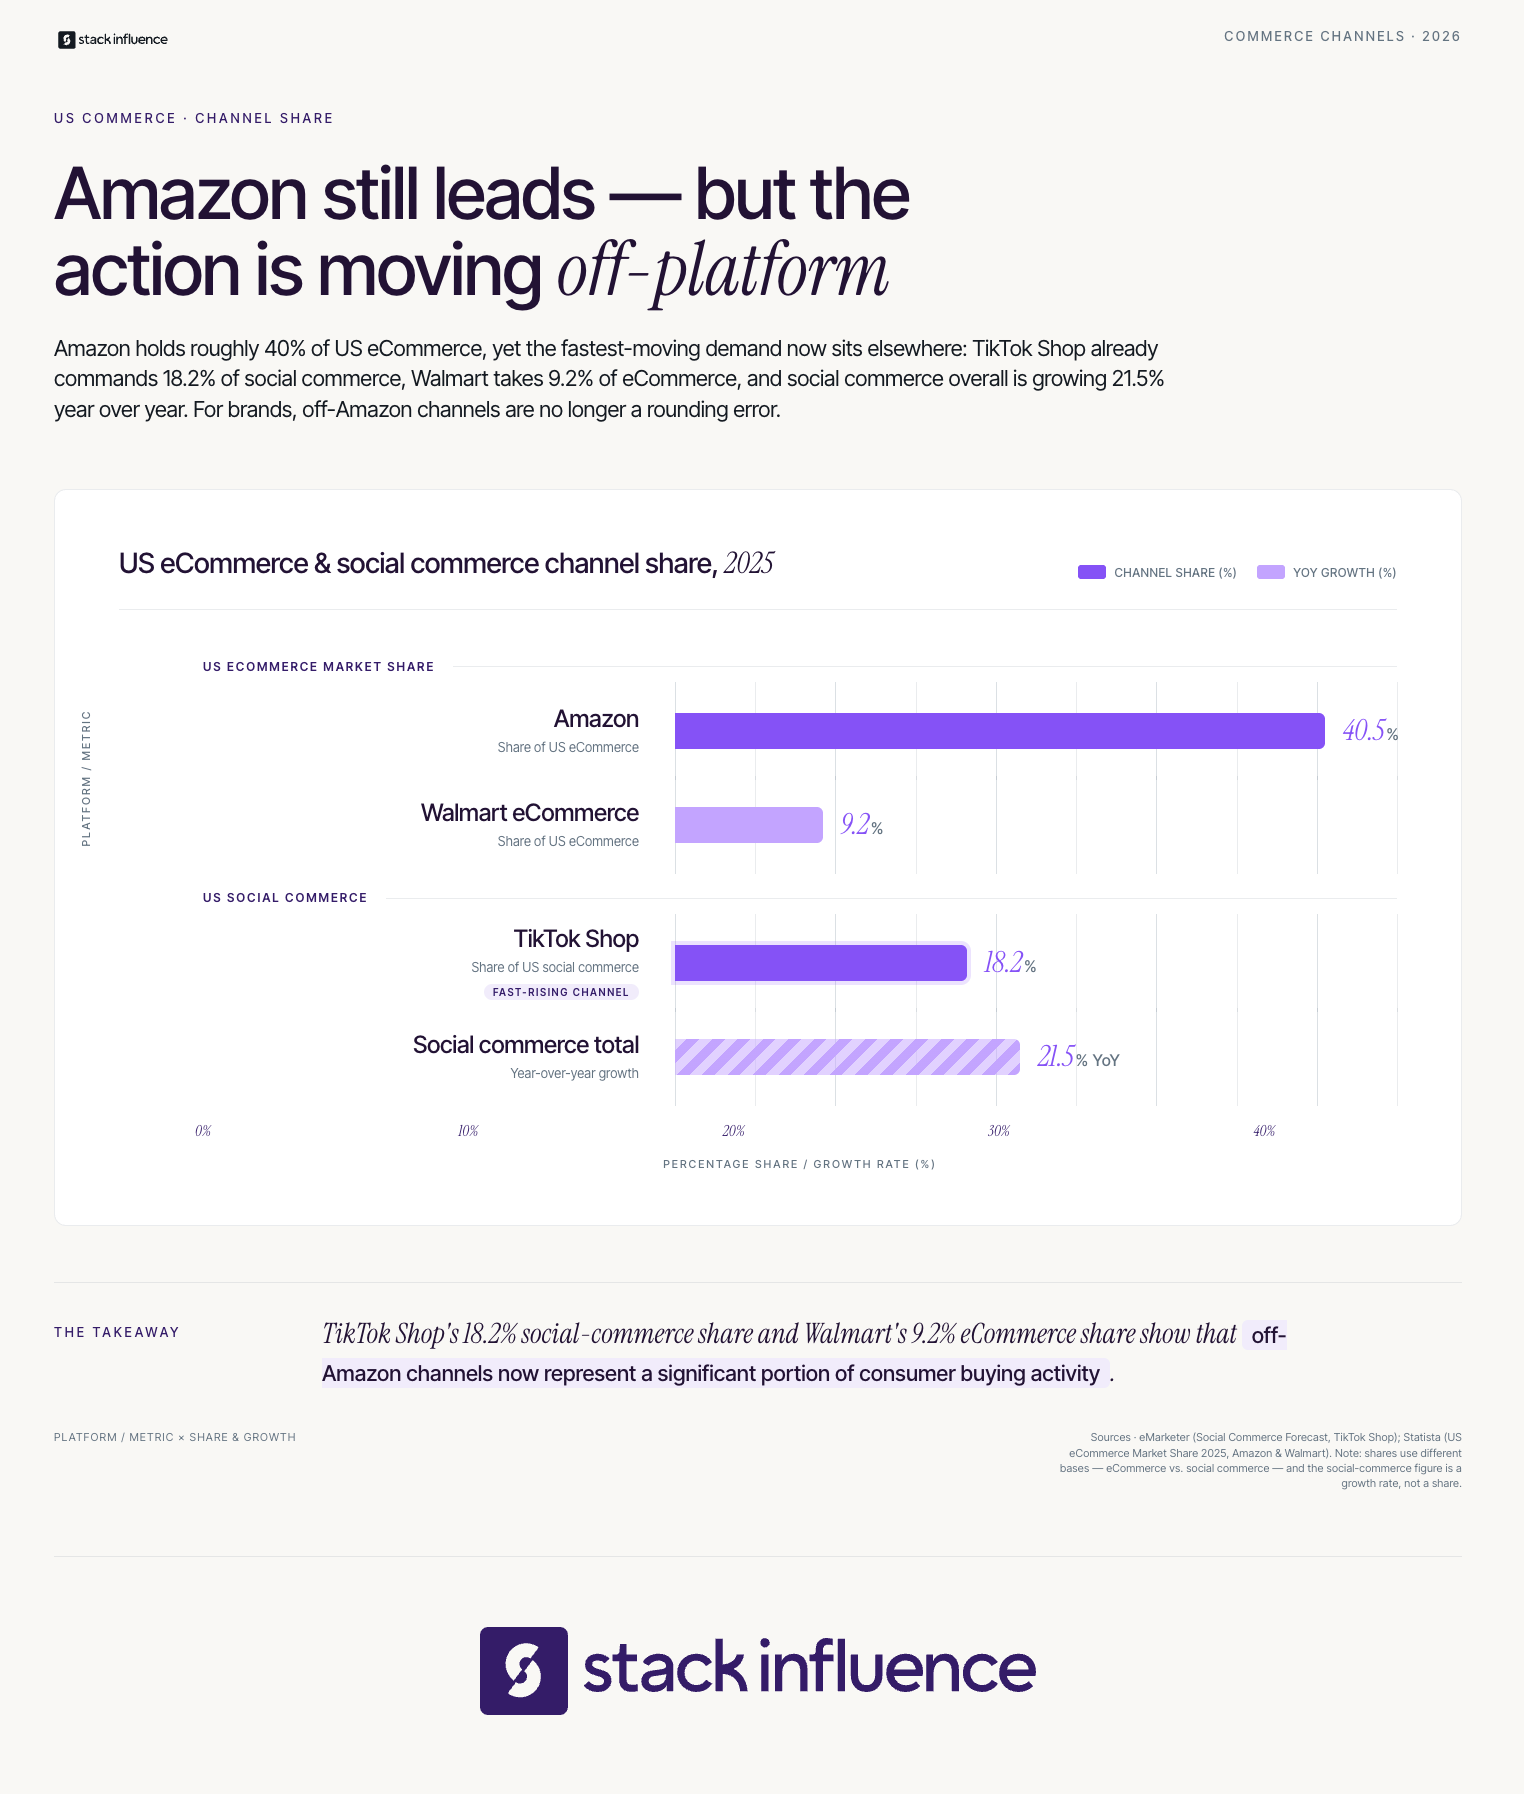
Here is what the 2026 indirect competitive landscape looks like by channel:
The UGC angle deserves special attention here. According to Emplifi's Q3 2025 Social Media Benchmarks report, social media posts featuring user-generated content drove 10.38 times higher conversion rates compared to non-UGC posts. This stat explains exactly why indirect competitors built on creator content are so effective: they are not just capturing attention, they are converting at rates that outperform traditional advertising by an order of magnitude.
The primary framework for Amazon sellers facing indirect competition is the Channel Priority Sequence (CPS), a five-step process that moves sellers from awareness of the threat to active revenue capture from off-platform channels. The CPS is designed to be executed in order because each step builds on the intelligence and infrastructure from the previous one.
Step 1: Category Audit Identify which indirect competitor channels are most active in your specific product category. TikTok Shop dominates beauty and personal care. Walmart leads in grocery and household essentials. Instagram Shopping is strongest in fashion and lifestyle. Your category determines which threat is most urgent.
Step 2: Buyer Behavior Mapping Map where your target buyer spends time before searching on Amazon. Run a 30-day audit of creator content in your category on TikTok, Instagram Reels, and YouTube Shorts. Note which products are being featured, which creators are driving engagement, and whether those products are routing to Amazon or competitor destinations.
Step 3: Creator Channel Activation Activate micro-influencer product seeding to place your product in front of creators who already have audience trust in your category. The goal at this step is content creation and discovery, not immediate conversion. Partnering with Amazon influencers who can bridge social discovery to Amazon purchase is the highest-efficiency move here.
Step 4: Attribution Infrastructure Set up Amazon Attribution before driving any off-platform traffic. Amazon Attribution is a free measurement tool that allows sellers to create unique tracking links for external campaigns and tie off-Amazon clicks to Amazon purchases within a 14-day attribution window. Without this step, all off-platform revenue is invisible in your Seller Central data.
Step 5: Brand Referral Bonus Enrollment Enroll in the Amazon Brand Referral Bonus program, which according to Amazon's official Brand Referral Bonus documentation, pays sellers an average 10% bonus on qualifying sales driven by non-Amazon marketing. This bonus is applied as a referral fee credit, directly improving margins on every attributed sale from external channels.
The Channel Priority Sequence is not a one-time exercise. Sellers should run through steps 1 and 2 on a quarterly basis as the indirect competitor landscape shifts, and revisit steps 3 through 5 whenever entering a new product category or seasonal push.
This is the most operationally significant decision in the entire indirect competitor response, and most guides avoid giving a direct answer. The correct answer depends on three variables: your product's AOV, your fulfillment capacity, and your content supply chain. Let the Channel Priority Sequence from the previous section inform which option fits your situation first.
For sellers with products under $40, TikTok Shop's impulse-purchase dynamic and 4.7% conversion rate make native selling worth testing. For sellers with products above $60, Amazon's checkout trust and Prime delivery expectation make routing traffic to Amazon via Attribution links the higher-converting path. For sellers in both ranges, the Amazon Influencer Program offers a middle path: creators build Amazon storefronts where their audience can purchase directly, combining social discovery with Amazon's fulfillment infrastructure.
From Stack Influence's experience running product seeding campaigns across beauty, home, and wellness categories, brands that route micro-influencer traffic through Amazon Attribution links rather than DTC channels convert at 15 to 22% higher rates on the Amazon destination, because Prime members complete checkout faster and with less friction than on brand-owned sites.
Here are the decision factors that determine which routing is right for your brand:
The Amazon Influencer Program is the cleanest bridge between social commerce and Amazon. Amazon influencers create shoppable storefronts on Amazon.com that function like curated social feeds, and buyers who click through from a creator's TikTok or Instagram content can purchase directly on Amazon without the friction of navigating a full search results page.
The secondary framework in this article is the Off-Platform Readiness Checklist (OPRC), a seven-item audit that sellers should complete before investing budget in any off-platform channel. Unlike the Channel Priority Sequence, which is a linear process, the OPRC is a yes/no diagnostic. Every "no" answer is a gap that must be closed before external traffic will convert efficiently.
Use the OPRC as follows:
The Off-Platform Readiness Checklist should be run against every new channel, every new creator partnership, and every seasonal campaign launch. It takes under ten minutes to audit and prevents the most common reasons external traffic campaigns fail to show up as revenue in Seller Central.
Amazon FBA sellers accustomed to measuring ACoS and ROAS inside Seller Central need a different measurement model when dealing with indirect competitors and off-platform traffic. The External Traffic Metric Stack (ETMS) is a four-component model built specifically for the indirect competitor context.
The four components of the ETMS are:
Across campaigns managed on the Stack Influence platform, eCommerce brands that track all four components of the External Traffic Metric Stack make attribution budget decisions 40% faster than brands tracking only ACoS, because the ETMS surfaces which creators and which channels are actually driving attributed revenue rather than just impressions.
According to Hector AI's analysis of 380 brand accounts, brands using Amazon Attribution alongside structured external traffic campaigns reduced their effective net referral fees by an average of 9.4%, a meaningful margin improvement that compounds significantly across high-volume campaigns.
The ETMS should be reviewed weekly during active creator campaigns and monthly as a portfolio-level audit. The most important single number in the model is the Net Referral Fee Rate, because it reveals whether the Brand Referral Bonus is functioning correctly and at what scale it needs to reach to justify increasing creator spend.

Here is the angle that most Amazon indirect competitor guides miss entirely. TikTok Shop, Instagram Shopping, and Walmart's marketplace are not just threats. They are high-intent traffic environments where buyers are already in a purchasing mindset, and sellers who participate in those environments on purpose can route a portion of that intent back to Amazon.
This is not a theoretical position. According to ringly.io's TikTok Shop statistics report, 97% of US TikTok Shop shoppers also shopped on Amazon in the past year. These are not separate buyer populations. They are the same buyers using multiple channels. A creator who posts on TikTok Shop can also link to an Amazon storefront in their bio or video description. A seller who participates in Walmart's marketplace gains access to a buyer demographic that increasingly overlaps with Amazon's core Prime base.
The practical playbook for turning indirect competitor platforms into traffic sources involves three moves:
Stack Influence's internal campaign data shows that Amazon sellers who deploy creator content across at least two off-platform channels while maintaining a structured Amazon storefront as the conversion destination see 30 to 45% higher total attributed revenue over a 90-day campaign window compared to sellers using single-channel creator strategies.
The Amazon Influencer Program is the most underused lever in this strategy. Amazon influencers earn commissions on storefront sales, which means their incentive is to drive qualified traffic to Amazon. Sellers who activate micro-influencer promotions on platforms where indirect competitors are strong get the benefit of both social discovery and Amazon's conversion infrastructure in a single campaign structure.
Amazon indirect competitors are no longer a future threat to monitor. TikTok Shop crossed $15.82 billion in US sales in 2025, Walmart's eCommerce share has more than doubled since 2017, and social commerce as a whole is on track to surpass $100 billion in 2026. For Amazon sellers, the question is no longer whether these channels are significant but how fast to build a structured response.
The Channel Priority Sequence and the Off-Platform Readiness Checklist give sellers a starting point that is practical, sequential, and measurable. The External Traffic Metric Stack provides the measurement model that makes off-platform investment legible alongside Seller Central data. And the Brand Referral Bonus, paired with Amazon Attribution, means that driving external traffic to Amazon is not a cost center but a margin improvement tool available to every Brand Registry seller today.
The sellers who treat amazon indirect competitors as a source of strategic intelligence, and a source of off-platform traffic they can redirect, will be the ones gaining market share in categories where everyone else is watching rankings fall and wondering why.
Most eCommerce sellers treat social media monitoring as a reactive fire-drill: check mentions when something goes wrong, screenshot a few posts, and move on. That approach leaves revenue on the table at a time when social conversations directly shape buying decisions. Over 90% of consumers say a brand's online reputation directly influences their purchasing decisions, according to newmedia.com's reputation management statistics. The right social media monitoring vendors turn passive brand awareness into a real-time competitive intelligence operation that feeds your influencer marketing, UGC strategy, and Amazon sales rank simultaneously.
Social media monitoring vendors are software platforms that collect, organize, and analyze public conversations happening across social networks, forums, review sites, and news outlets. A monitoring vendor ingests keywords, brand names, product names, hashtags, and competitor terms, then surfaces patterns in real time. The category sits inside a broader ecosystem that includes social media management tools, influencer marketing platforms, and UGC platforms.
The distinction between monitoring and listening matters in practice. Monitoring tracks what is being said, logging mentions and flagging spikes. Social listening, which the best vendors include, goes one layer deeper by analyzing why conversations are happening and what brands should do about them. For eCommerce sellers juggling an Amazon storefront, a Shopify influencer marketing channel, and multiple creator partnerships, the two capabilities work together to protect brand reputation and identify growth opportunities before competitors do.
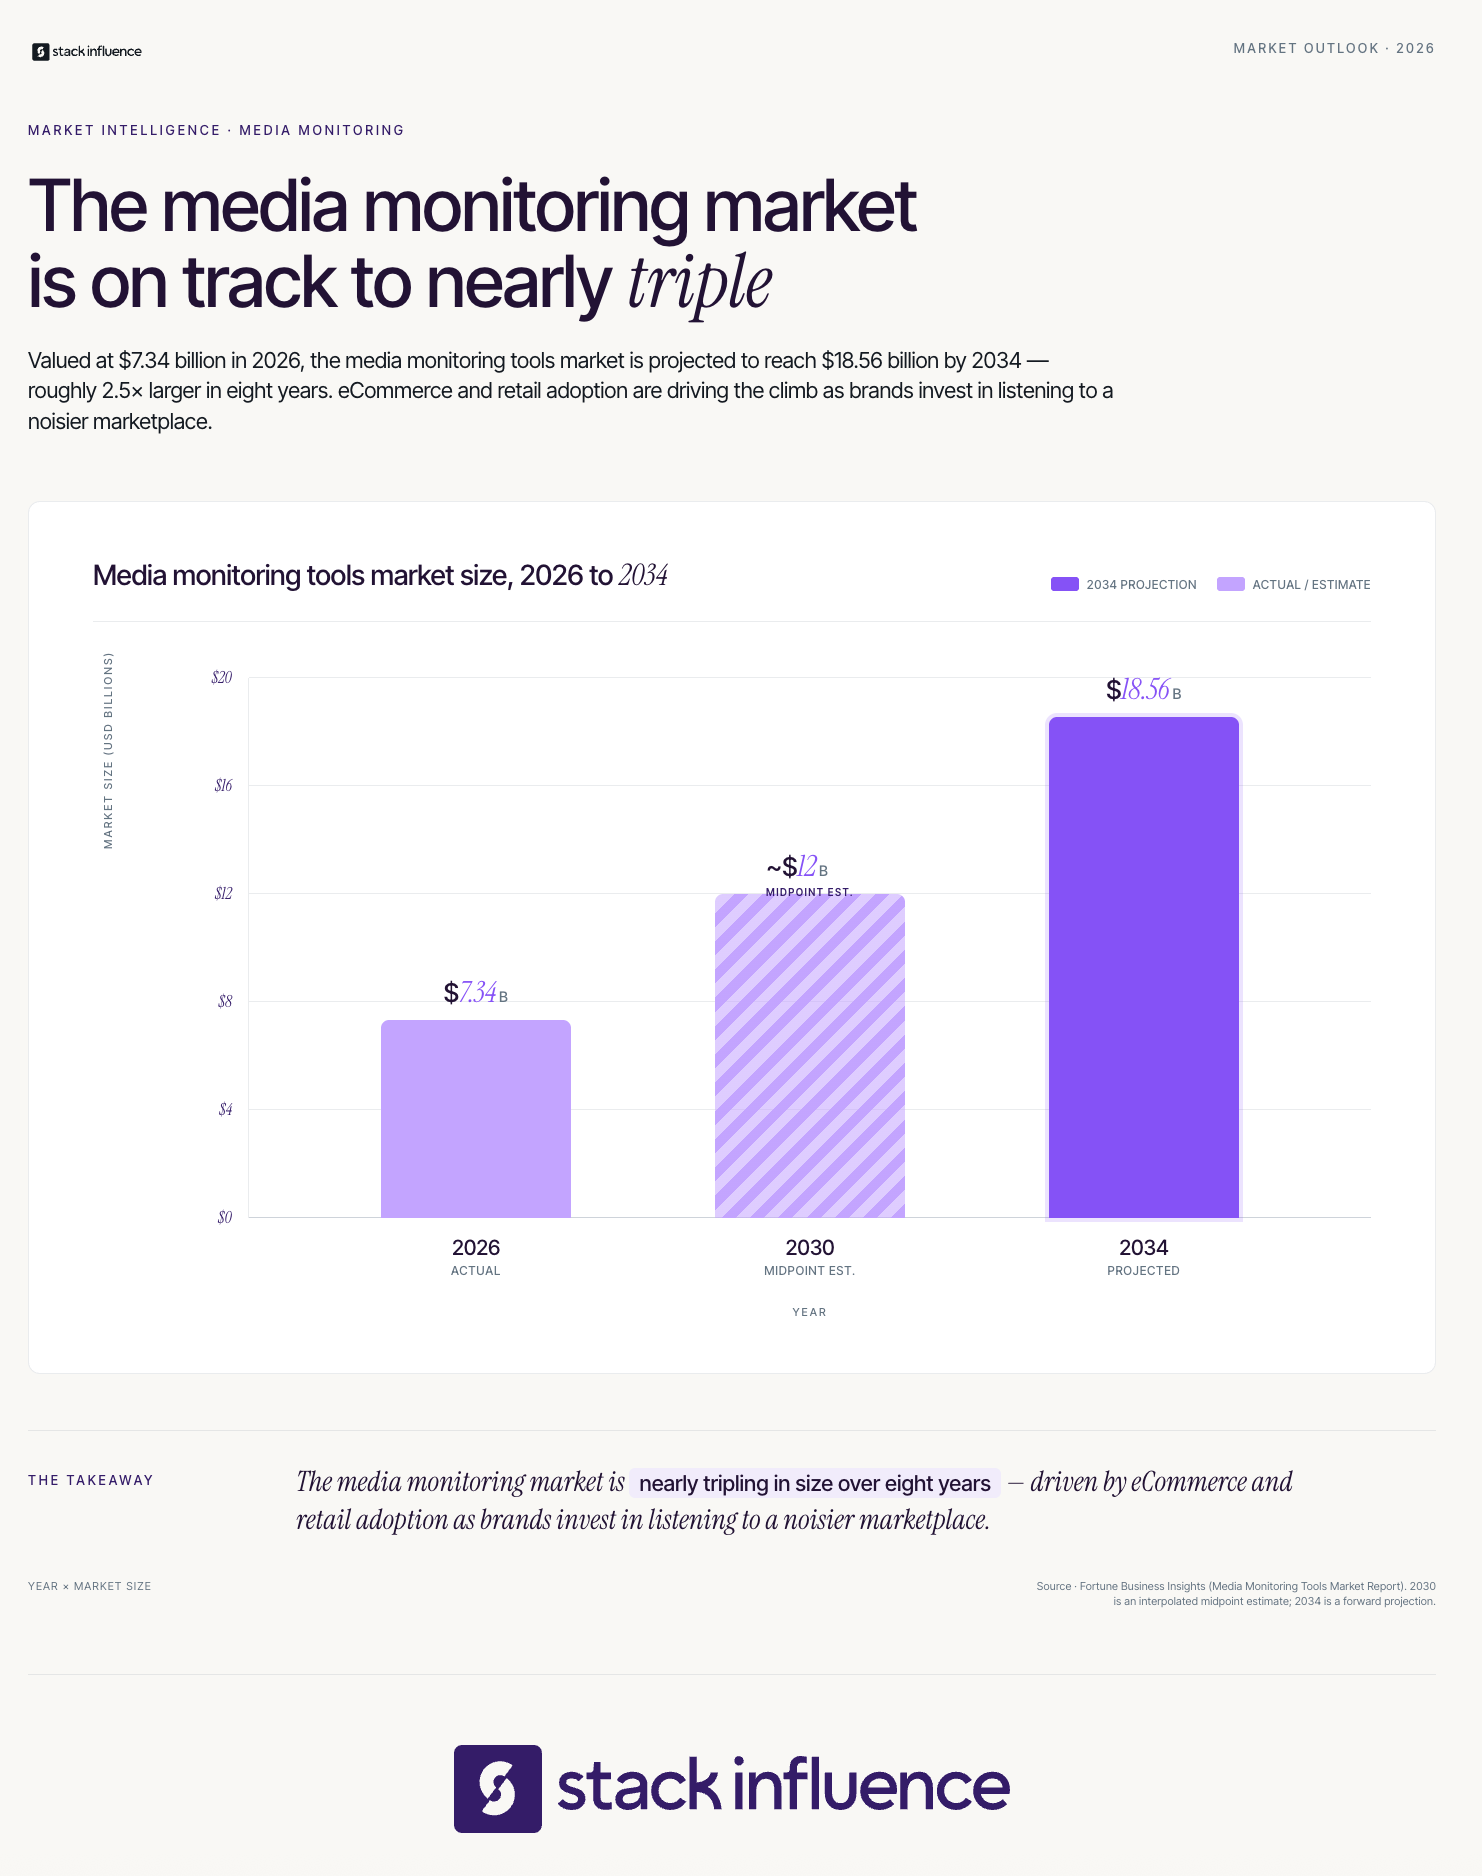
According to Fortune Business Insights' media monitoring market report, the global media monitoring tools market is projected to grow from $7.34 billion in 2026 to $18.56 billion by 2034, a CAGR of 12.3%. Retail and eCommerce represent the largest application segment by revenue share, which reflects how critical this infrastructure has become for DTC brands and Amazon FBA operators competing at scale.
Key things a quality monitoring vendor tracks:
Selecting from dozens of social media monitoring vendors without a structured process leads to regret. The SIGNAL Framework is a five-variable evaluation model designed specifically for eCommerce sellers who need monitoring data to feed influencer campaigns, product decisions, and marketplace performance simultaneously.
The five variables in the SIGNAL Framework are:
Apply the SIGNAL Framework before any vendor demo. Go into the demo with your own test keywords, your competitor names, and a recent brand mention you already know about. A vendor that cannot surface the mention you already have documented is not ready for your use case.
According to Hootsuite's social listening strategy guide, monitoring social channels ties directly to metrics like engagement, share of voice, and sentiment, which together show how marketing campaigns deliver on business goals. The SIGNAL Framework operationalizes those three metrics by giving eCommerce teams a consistent scoring rubric for every vendor conversation.
From Stack Influence's experience running micro influencer campaigns for eCommerce brands, monitoring vendors that capture untagged mentions consistently surface 30 to 40% more organic creator content than tools limited to tagged posts, making them substantially more useful for brands running automated product seeding programs where creators post on their own schedule.
Not every feature category in a social media monitoring vendor is equally valuable for eCommerce. Most vendors are built for enterprise PR teams, which means their default dashboards emphasize broadcast media coverage and top-tier news outlet mentions. Sellers running influencer campaigns and managing an Amazon storefront need a different feature priority stack.
The features that generate the most operational value for eCommerce sellers are:
The Influencer Marketing Hub's 2026 Benchmark Report notes that the share of organizations relying on software for social listening efforts surged from 44% in 2024 to 78% in 2025, a dramatic shift away from manual monitoring. That acceleration means the barrier to entry for structured monitoring has fallen, and sellers who still rely on spreadsheets are operating at a structural disadvantage relative to competitors who automated this workflow 12 months ago.
Brands building or expanding creator partnerships should also evaluate the vendor's UGC rights management capabilities. If a nano influencer posts organic content about your product and you want to repurpose it as a paid ad on Meta or TikTok Spark Ads, the monitoring tool should make it easy to log rights requests and store approved assets for reuse. This is where micro influencer promotions workflows and monitoring vendor capabilities converge most directly.
The SIGNAL Framework tells you how to choose a vendor. The Monitoring-to-Revenue Checklist tells you what to do with the vendor once it is live. These are eight operational steps that convert raw monitoring data into measurable eCommerce outcomes.
The Monitoring-to-Revenue Checklist includes:
The Monitoring-to-Revenue Checklist works independently of any specific vendor. Run through it every quarter to confirm your monitoring setup is still producing actionable signal rather than just volume metrics with no downstream impact.
Stack Influence's internal campaign data shows that eCommerce brands running structured monitoring alongside their creator partnerships identify reusable UGC assets at a rate nearly 2.5 times higher than brands relying solely on creator check-ins, because organic mentions from brand ambassadors and product seeding recipients often surface on platforms and in formats the brand team did not anticipate.
Attribution is the place where most sellers get social media monitoring wrong. They track sentiment and mentions well but never connect those signals to actual conversion data. A structured metric model solves this by defining the exact outputs your team reports on after every campaign period.
The SEEN Metric Stack is a four-component attribution model designed for eCommerce sellers using social media monitoring data alongside influencer campaigns on Amazon and Shopify.
The Amazon Attribution component of the SEEN Metric Stack deserves particular attention. According to the Amazon Ads guide to Amazon Attribution, the Brand Referral Bonus program pays sellers an average 10% bonus on product sales driven by non-Amazon marketing measured through Attribution tags. That means every influencer campaign, every social post, and every creator partnership that drives traffic to your Amazon storefront can generate a direct fee credit in addition to the revenue itself.
According to Marknology's Amazon Attribution guide, Amazon Attribution uses a 14-day lookback window, meaning sales that occur within 14 days of a tagged link click are attributed to that campaign. For eCommerce sellers evaluating the ROI of influencer campaigns and creator economy partnerships, this 14-day window is the critical measurement boundary between a campaign that appears to underperform and one that actually delivered delayed conversions.
Across campaigns managed on the Stack Influence platform, eCommerce brands that use monitoring data to identify which creator posts generate the highest Amazon Attribution click volumes before scaling a campaign see campaign ROAS improve by an average of 20 to 35%, because they are reallocating budget toward the content types and creator tiers that have already demonstrated conversion signal rather than guessing at scale. Apply the SEEN Metric Stack principles before your next product launch to establish a clean pre-campaign baseline.

Most vendor comparison guides focus almost entirely on feature lists. The number of platforms covered, the size of the historical data archive, the sophistication of the sentiment engine. These things matter, but they are not the primary reason monitoring programs fail at eCommerce companies.
The actual failure mode is workflow disconnection. A brand buys a monitoring tool, assigns one person to check the dashboard weekly, and never builds the link between what the tool surfaces and what the marketing team does next. Mentions spike after a successful influencer seeding campaign, the data sits in a dashboard, and nobody connects the volume to the AMZ listing that saw a search rank improvement that same week.
Data from archive.com's social listening statistics report shows that brands with mature social listening capabilities respond to issues 4.3 times faster than peers relying only on traditional monitoring. That speed advantage is not primarily a technology gap. It is an operational gap: mature brands have defined response playbooks, assigned owners for each alert type, and a clear escalation path from monitoring signal to marketing or customer service action.
The specific belief most eCommerce guides reinforce is that buying a more expensive vendor with more features will solve the problem. The alternative is to start with a simpler vendor and a tight workflow: one person owns the weekly review, three alert types are configured from day one, and the output feeds a standing agenda item in your weekly marketing meeting. Sellers who take this approach with a mid-market tool consistently outperform sellers who buy enterprise monitoring software and treat it as a passive report generator.
For sellers building out influencer seeding workflows, the monitoring workflow gap shows up most acutely after a product seeding campaign. Dozens of micro influencers post organic content, mentions spike, and without a monitoring-to-action process, the brand collects zero UGC assets, misses the sentiment data, and cannot connect the creator activity to the Amazon BSR improvement that followed. The solution is not a better tool. It is the Monitoring-to-Revenue Checklist applied immediately after go-live.
Social media monitoring vendors and influencer marketing overlap most directly in three areas: creator discovery, campaign measurement, and UGC asset capture. Getting all three right requires treating your monitoring vendor as an input into your creator partnerships workflow rather than a separate reporting tool.
According to digitalapplied.com's 2026 influencer marketing statistics, micro-influencers deliver 3.2x higher engagement at 60% lower cost compared to mega-influencers. That performance advantage is only fully captured if your monitoring vendor surfaces the micro influencer mentions that happen organically before a formal brand sponsorship relationship is established. Many of the best creator partnerships start not with a pitch but with a brand noticing a genuine mention and reaching out to formalize it.
For Amazon sellers specifically, connecting monitoring to the Amazon Influencer Program and brand deals workflow means each creator you work with should have a unique Amazon Attribution tag. When your monitoring tool flags a spike in mentions correlated with an ASIN's conversion rate improvement, you can trace the source creator, identify which content type drove the traffic, and replicate that format in future influencer campaigns. This closes the loop between the SIGNAL Framework vendor selection criteria and the SEEN Metric Stack reporting model.
Based on Stack Influence's work with eCommerce brands running product seeding campaigns at scale, sellers who integrate monitoring vendor data with their creator pipeline identify organic brand advocates averaging 3.4 times more authentic engagement than outbound-recruited creators, because buyers who already purchase and post about a product bring a credibility signal that scripted brand partnerships cannot replicate at the same cost efficiency. Sellers on Shopify can further extend this by exploring Shopify influencer marketing integrations that feed monitoring data directly into creator activation workflows.
Social media monitoring vendors are not a compliance checkbox or a brand safety measure you activate after something goes wrong. For eCommerce sellers, they are the infrastructure layer that connects every influencer campaign, every UGC asset, and every creator partnership to a measurable outcome. Start with the SIGNAL Framework to evaluate vendors against your actual channel mix. Apply the Monitoring-to-Revenue Checklist to operationalize the data you collect. Report results through the SEEN Metric Stack so every campaign period connects share of voice and EMV to external attribution revenue and net sentiment trends.
The sellers who extract the most value from social media monitoring vendors are not the ones with the most sophisticated tools. They are the ones who have built the tightest feedback loop between what the data shows and what the marketing team does next. If your current setup cannot answer the question "which creator drove this Amazon BSR improvement last week?", that is the gap the right monitoring vendor and a disciplined workflow will close.
Most content creators already know that polished ads are losing ground. What fewer understand is exactly why that shift is happening, how fast it is accelerating, and what it means for the brand deals and creator partnerships available to them right now. The debate between UGC vs traditional advertising is not theoretical anymore. It has real consequences for which creators brands hire, how much they pay, and how long those relationships last. This guide breaks down the structural differences between the two approaches, gives you a named framework for understanding where your content fits, and shows you how to measure and communicate your value to any brand.
The creator economy has a positioning problem. Many content creators still pitch themselves as distribution channels, quoting follower counts and reach numbers to prospective brand partners. That framing made sense when broadcast reach was the dominant metric in marketing. It does not reflect how DTC brands and Amazon sellers actually evaluate creator performance today.
Brands looking for influencers in 2026 are primarily sourcing two things: trust signals and reusable assets. A trust signal is any piece of content that a genuine person created about a product without it looking like an ad. A reusable asset is a photo, video clip, or testimonial that the brand can repurpose across paid social, product pages, email, and even their Amazon storefront. Once brands start collecting customer-generated photos, videos, and testimonials, tools like UGCify can help organize and display that content on WooCommerce product pages through shoppable galleries, making it easier to turn authentic customer experiences into conversion-focused social proof.
The shift toward UGC video and authentic short-form content is not a trend to wait out. It is a structural change in how influencer marketing operates at the campaign level. Creators who adapt their pitch around content quality, usage rights, and conversion outcomes will consistently win more brand deals than those still selling audience size alone.
Here is what to start doing differently right away:
Nano influencers who specialize in a single category, such as home organization, skincare, or fitness supplements, are particularly well-positioned. Their audiences are small but precise, and precision is what drives conversion for niche product categories.
User-generated content (UGC) is any content created by a real person about a product, service, or brand, whether that person is a paying customer, a gifted reviewer, or a professional UGC creator hired specifically to produce authentic-style assets. Traditional advertising is brand-controlled content produced through agencies or in-house teams, designed to broadcast a message to a mass audience through paid media placements like TV spots, banner ads, or paid search.
The practical difference comes down to origin and perception. Traditional ads are recognized as brand messaging, which means consumers apply a credibility discount automatically. UGC carries no such discount because it appears to originate from someone with no commercial motive, or at least a less obvious one. That credibility gap is the entire economic engine behind influencer marketing platforms and UGC platforms.
According to Fortune Business Insights, the global UGC platform market is projected to grow from $8.48 billion in 2026 to $64.31 billion by 2034, registering a CAGR of 28.8%. That projection is not driven by novelty. It reflects brands reallocating budget from channels that are losing consumer trust toward formats that hold it.
For creators, understanding this definition at a structural level matters because it determines where you sit in a brand's content strategy. You are not replacing a TV commercial. You are providing the trust layer that a TV commercial cannot manufacture, and that distinction is worth a premium to the right brand partners.
Here are the key content types that fall into each category:
The hybrid category is where the majority of high-growth eCommerce spend is flowing right now, because it combines the targeting precision of paid advertising with the trust signals of authentic creator content.
The Signal-to-Content Framework is the primary decision model for understanding where any piece of content falls on the UGC-to-advertising spectrum, and more importantly, how to maximize the strategic value of what you create. It maps every content deliverable against two variables: authenticity signal strength and commercial reusability. Creators who consistently score high on both dimensions command the best brand deals and the longest-lasting creator partnerships.
The framework has four quadrants, described as a bulleted decision model rather than a table:
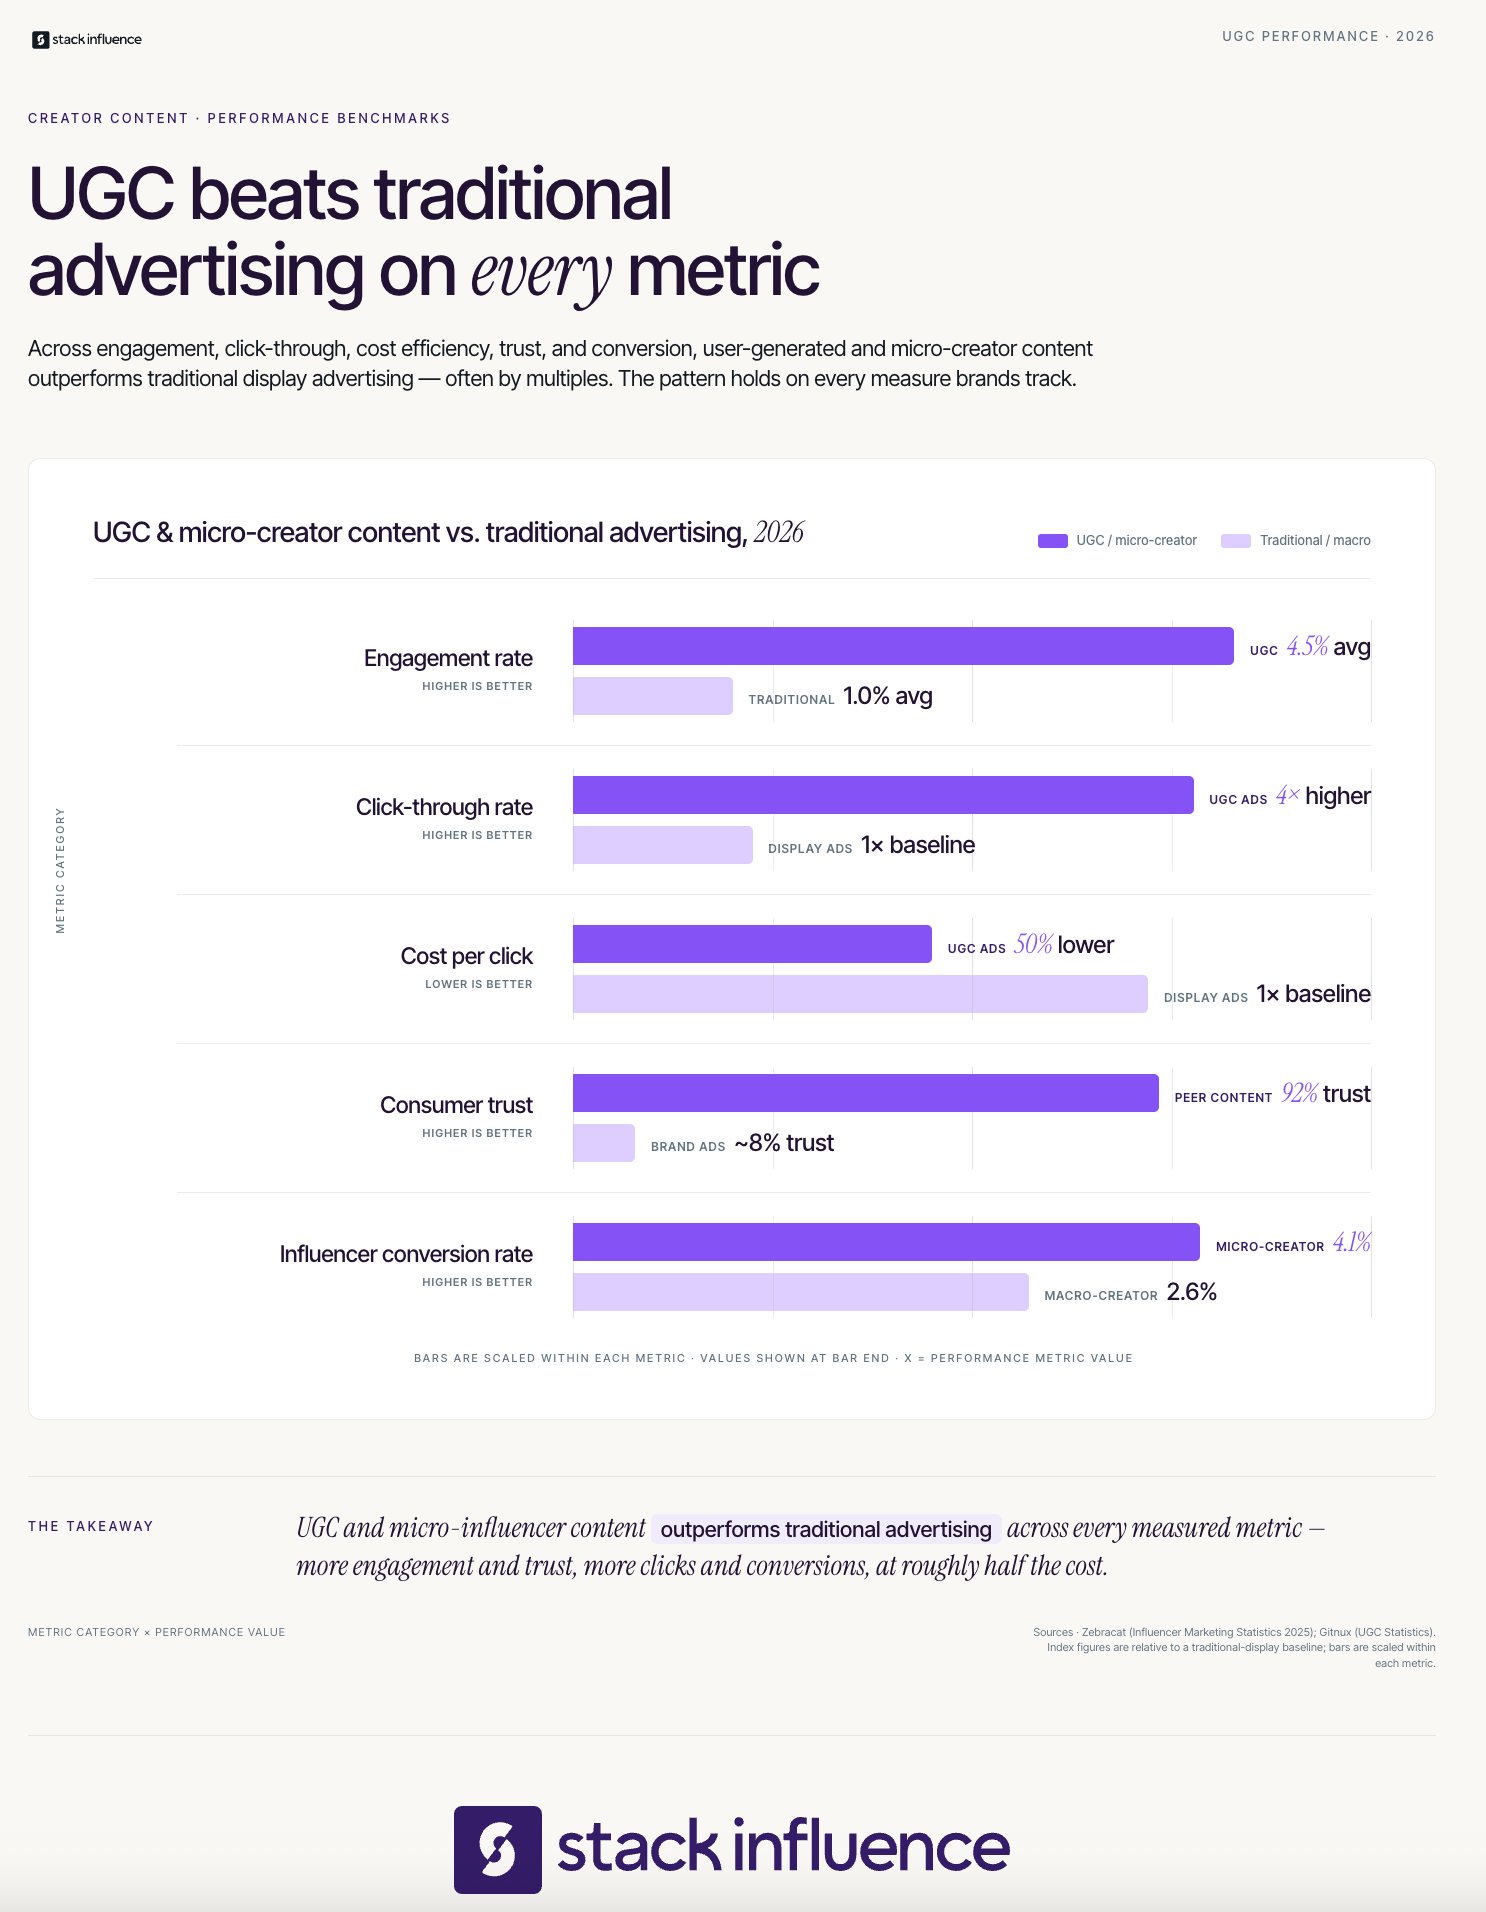
Research from Zebracat shows that micro-influencer campaigns achieve conversion rates of 4.1%, compared with 2.6% for macro-influencer campaigns, and that 61% of brands report higher ROI from micro-influencers than macro-influencers. The Signal-to-Content Framework explains why. Micro influencers naturally produce Tier 1 and Tier 2 assets because their content style is rooted in genuine category interest, not broadcast performance.
According to Sociallypowerful, nano influencers have engagement rates of 6 to 9%, while micro influencers' engagement rates range around 3 to 5%, and brands using influencer marketing are 2.3 times more likely to meet their campaign goals than those relying only on traditional ads. The engagement premium on smaller creator tiers is not a coincidence. It is the direct output of higher signal strength in the content those creators produce.
Stack Influence's internal campaign data shows that in beauty and personal care categories, micro influencers consistently deliver UGC reuse rates above 60%, compared to roughly 40% in general lifestyle categories. This difference maps precisely onto Tier 1 vs Tier 2 Signal-to-Content placement: category-specific creators produce content that brands can actually deploy in paid channels, which is why those partnerships generate repeat business rather than one-off brand deals.
When pitching a brand, walk through the Signal-to-Content Framework explicitly. Explain which tier their current content strategy is operating in, and show how your approach delivers Tier 1 assets that can run in their ad library. That conversation positions you as a strategic partner, not a platform vendor.
DTC brands and Amazon sellers evaluate creator partnerships differently from traditional advertisers, and understanding those differences will help you tailor your pitch for maximum effectiveness. Traditional advertisers measure brand reach and frequency. eCommerce brands measure traffic quality, conversion rate, and the revenue tied to a specific link.
For Amazon sellers running influencer campaigns, the measurement infrastructure is now sophisticated enough to trace individual creator traffic directly to product sales. Amazon Attribution is a free tagging tool that uses a 14-day last-touch model, allowing sellers to see exactly how much revenue a creator's link generated. The Amazon Brand Referral Bonus stacks on top of that attribution, averaging 10% back to the seller on product sales driven by off-Amazon traffic. The result is that a seller's effective cost to acquire a customer through a creator link is meaningfully lower than through paid search.
According to Carbon6's UGC strategy guide, the Amazon Influencer Program is specifically designed to create shoppable content directly on Amazon's platform, and Amazon says the Brand Referral Bonus averages 10% of product sales driven by eligible non-Amazon efforts, including purchases made within a 14-day attribution window. For creators who want to participate, building and optimizing an Amazon storefront through the Amazon Influencer Program is one of the most direct ways to demonstrate measurable sales attribution to brands.
Shopify influencer marketing operates similarly. DTC brands using Shopify can issue unique discount codes or affiliate links to individual creators, producing clean revenue attribution that does not exist in traditional advertising. Across campaigns managed on the Stack Influence platform, eCommerce brands that use creator-specific attribution links alongside product seeding programs see 25 to 35% more repeat creator activations, because the data gives them confidence to reinvest in relationships that are clearly moving revenue.
Here is what Amazon FBA sellers and DTC brands are looking for when evaluating a UGC creator:
Creators who can speak fluently to all four of these criteria during a brand pitch are operating in a different tier than those who can only discuss followers and reach.
There is a widely held belief in the creator economy that any influencer with a large following represents better value for a brand than a smaller creator, simply because more eyes on the content means more potential customers. That belief is not supported by the data, and the trust dynamics behind UGC vs traditional advertising explain exactly why.
A Nielsen Global Trust in Advertising study found that 92% of consumers trust peer recommendations over branded content, while Edelman's 2025 Trust Barometer found that 80% of consumers now look to peers rather than brand experts as the gold standard for accurate brand information. The trust advantage that UGC holds over traditional advertising does not scale linearly with follower count. A creator with 12,000 highly engaged followers in a specific niche often produces stronger trust signals than a macro-influencer with one million loosely affiliated followers across many categories.
The contrarian implication here is specific: brands that have been measuring influencer campaign success by total impressions are optimizing for a proxy metric that has a weak relationship to actual purchase intent. The alternative is to measure trust signal strength directly, using engagement rate as a proxy for audience responsiveness, and conversion rate as the downstream confirmation. Creators can help brands make this shift by proactively sharing both metrics in their pitch materials.
This is an actionable change you can make immediately. Pull the engagement rate and any available conversion data from your last three branded posts. Present those numbers before your reach statistics in every future pitch deck or creator brief. That reordering signals that you understand how eCommerce brands think, and it shifts the conversation from "how many people saw this?" to "how many people acted?"
From Stack Influence's experience running product seeding campaigns at scale, brands that shift their creator selection criteria from follower count to engagement-to-conversion alignment consistently see stronger return on ad spend during the first 60 days of a new influencer campaign. The trust gap only generates revenue when the creator's audience is genuinely predisposed to buy the product in question.
Most articles about UGC performance list generic KPIs like impressions, reach, and engagement rate without explaining how those metrics connect to business outcomes for the brand. The UGC Performance Stack is a named metric model designed to give creators and brands a shared vocabulary for evaluating campaign performance across the full funnel.
The UGC Performance Stack has four layers, each building on the previous one:
As reported by Billo, Forrester research shows 68% of consumers identify UGC as the most authentic content format, up from 60% the previous year, while UGC registers as 9.8x more authentic than influencer content. That authenticity premium is not automatic. It depends on content that scores high on Layer 1 of the UGC Performance Stack, meaning the audience engages because they trust the creator's voice, not because the brand paid to boost the post.
According to Carbon6's UGC strategy guide, the Amazon Influencer Program is specifically designed to create shoppable content directly on Amazon's platform, and Amazon says the Brand Referral Bonus averages 10% of product sales driven by eligible non-Amazon efforts, including purchases made within a 14-day attribution window. Amazon influencers who understand Layer 4 of the UGC Performance Stack can use this data to show a seller their true cost of customer acquisition, which is a compelling argument for increasing creator fees.
Use the UGC Performance Stack as a reporting template at the end of every brand collaboration. Send the brand a one-page summary covering all four layers, even if some numbers are estimated. Brands that receive structured post-campaign data from creators are more likely to convert those relationships into long-term ambassador programs rather than one-off projects.

The growth of UGC as a marketing category is not just good news for brands. It is a structural opportunity for content creators who position themselves correctly inside the creator economy. The key is understanding that the demand for UGC creators is not the same as the demand for influencers in the traditional sense.
Data from Zebracat's influencer marketing research shows UGC-based ads achieve 4x higher click-through rates and a 50% reduction in cost-per-click compared to traditional digital ads. That performance gap is what is driving brands to hire dedicated UGC creators, sometimes with no social following at all, specifically to produce content for their ad libraries. If you have the filming, editing, and storytelling skills to produce Tier 1 signal-content, your follower count is essentially irrelevant for this type of work.
There are now two distinct career paths inside the creator economy related to UGC. The first is the traditional influencer path: build an audience, charge for access to that audience through sponsored posts and brand sponsorships. The second is the UGC creator path: produce high-converting authentic content as a deliverable, charge for the content itself and the usage rights, and maintain a portfolio of UGC work that demonstrates conversion performance rather than reach.
The UGC Performance Stack applies differently across both paths:
Product seeding, a campaign structure where brands send free product in exchange for content, is one of the most accessible entry points into creator partnerships for early-stage creators. It requires no paid sponsorship negotiation, and it generates the portfolio content you need to demonstrate Tier 1 Signal-to-Content capability to future paying brands. Micro influencer agency networks and platforms that specialize in automated product seeding make it straightforward to participate in these campaigns at volume.
The second framework every creator should know is the Content Asset Ladder, a secondary named framework that organizes your deliverables by commercial value to the brand.
The Content Asset Ladder:
Every time you move a brand client from Rung 1 to a higher rung of the Content Asset Ladder, your fee should reflect that additional commercial value. Brands that understand the UGC Performance Stack will recognize this immediately and accept the pricing.
The brands that work with micro influencers consistently, rather than relying on one-time macro campaigns, are building sustainable content libraries through relationships like these. As a creator, every long-term brand ambassador relationship you build is not just recurring income. It is a case study in the Content Asset Ladder that makes your next pitch stronger.
The debate about UGC vs traditional advertising has essentially been settled by consumer behavior. Trust lives in peer content, conversion lives in authentic formats, and the ROI data consistently favors creator-driven content over broadcast advertising for eCommerce applications. What remains unsettled for most creators is how to translate this shift into better-paying, longer-lasting brand partnerships.
The Signal-to-Content Framework and the UGC Performance Stack give you two concrete tools to use in every campaign conversation. Apply the Signal-to-Content Framework to understand what tier your content operates in and how to move toward Tier 1. Apply the UGC Performance Stack to measure and report campaign outcomes in a language that DTC brands and Amazon sellers actually care about. Use the Content Asset Ladder to structure your deliverable packages so that every collaboration can grow in value over time.
The creator economy is not slowing down. Brands are committing more of their marketing budgets to creator-driven content every year, and the standards for what constitutes high-quality UGC are rising with that investment. Creators who understand the structural mechanics of UGC vs traditional advertising are the ones who will be invited into that increasing spend rather than watching it flow to someone else.
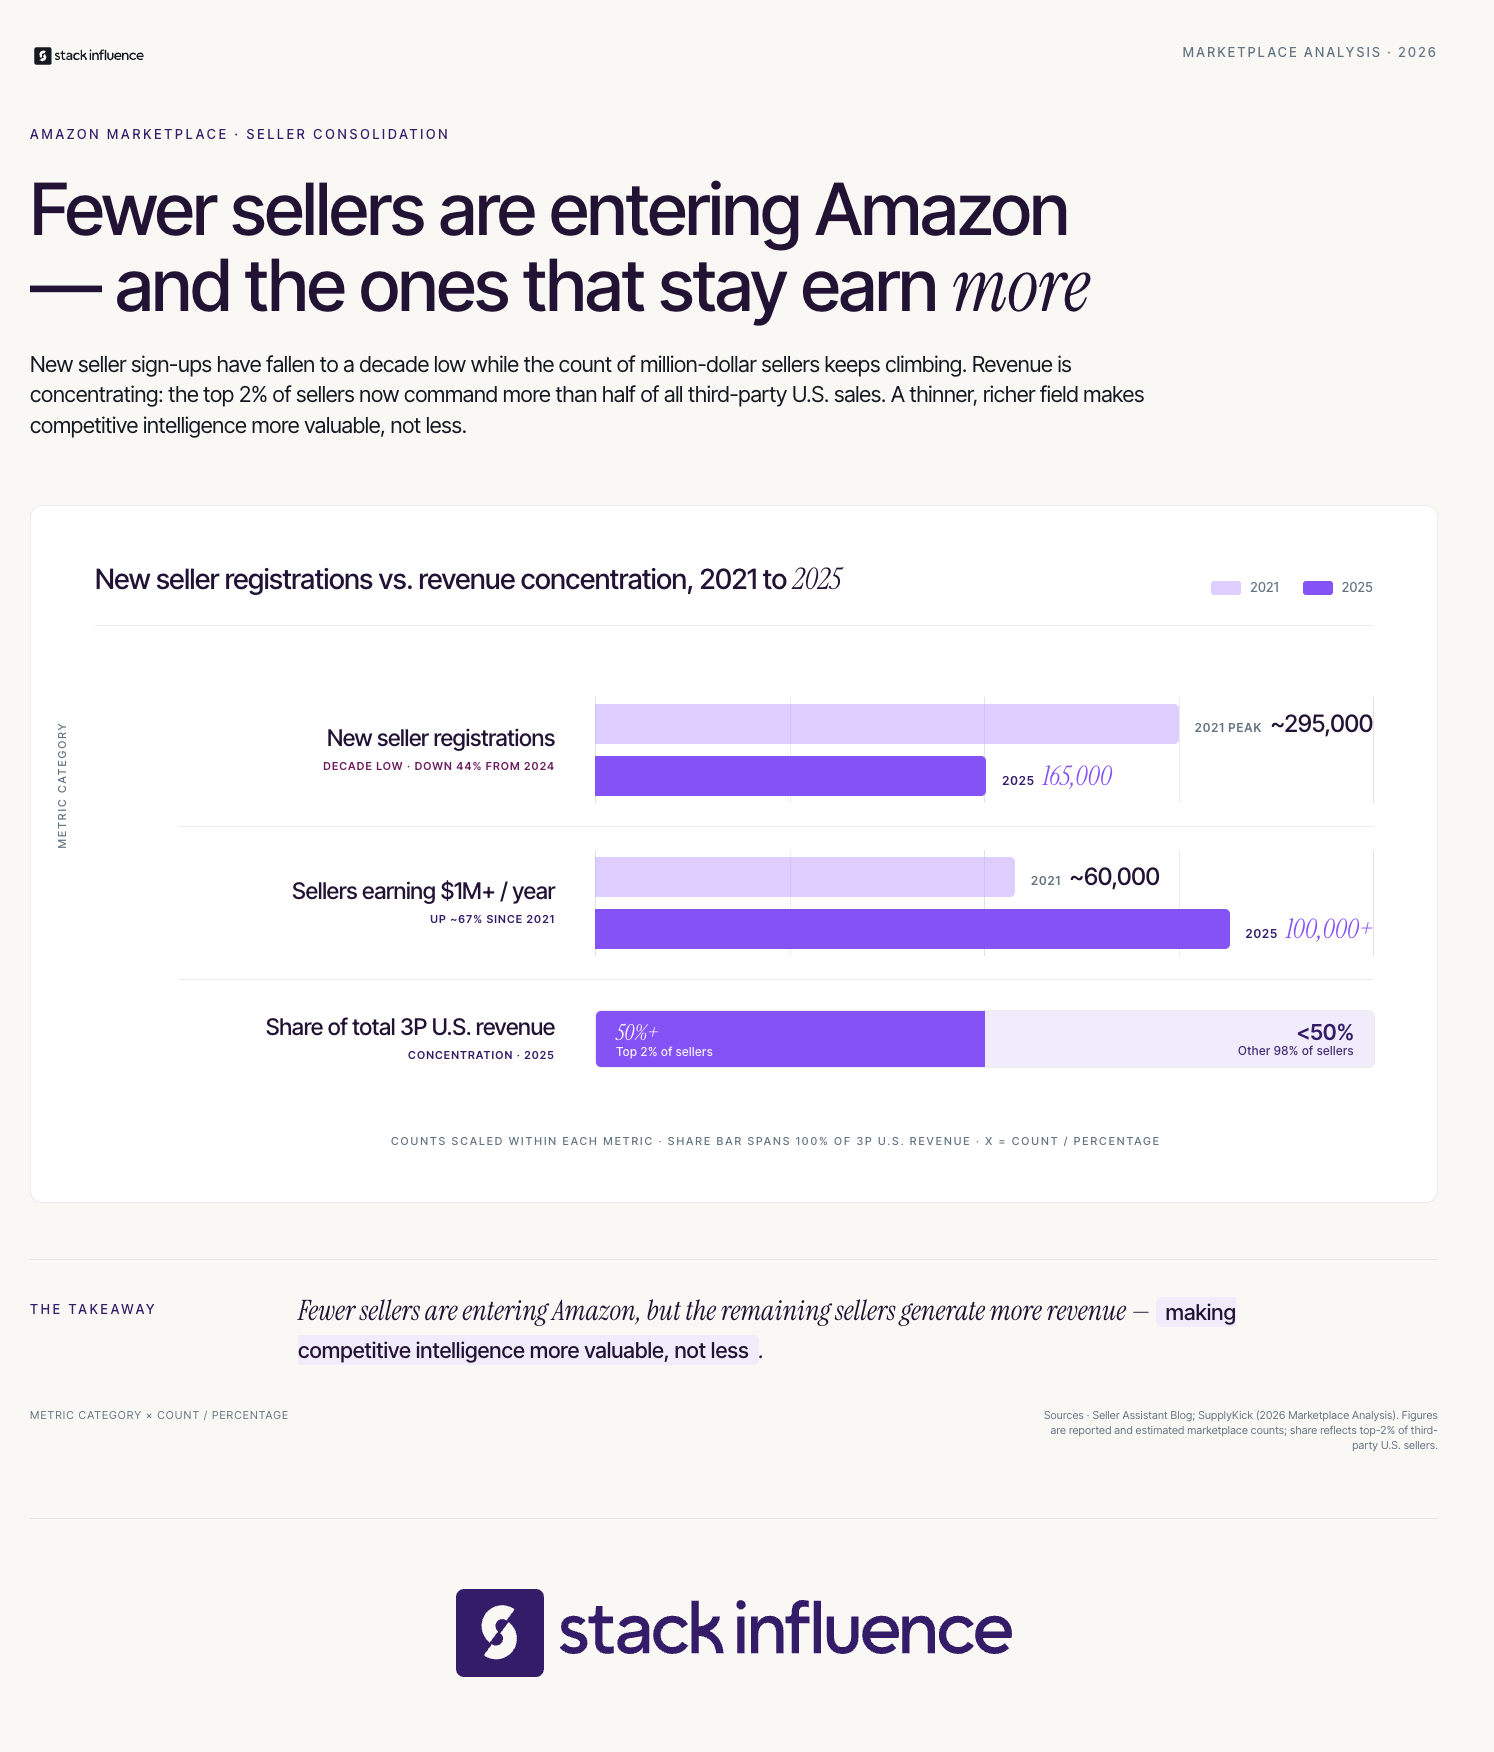
Most eCommerce sellers check their own sales dashboard every morning. Far fewer spend equal time studying the sellers who are quietly eating into their category. That gap is where competitive advantage is made or lost on Amazon. The Amazon marketplace is consolidating fast: active sellers have dropped from 2.4 million to 1.65 million, new registrations hit a decade low of 165,000 in 2025, yet third-party sellers now account for 62% of units sold — an all-time high. A structured amazon competitor analysis is no longer optional for serious Amazon FBA and DTC brands. This guide gives you a repeatable system to map the competitive field, find the gaps rivals leave open, and measure the actions that actually move market share.
With sellers joining the Amazon marketplace each day, existing sellers need to conduct Amazon competitor analysis to keep a finger on the pulse of the landscape — understanding exactly how competitors price their products, source their inventory, build their listings, and market off-platform. The challenge is that most sellers do this reactively, pulling data only when a listing tanks or a new rival appears. A proactive system changes that.
The framework introduced here is called the Competitive Clarity System, a five-step numbered sequence that runs on a defined cycle. It is designed for Amazon sellers and DTC brands who want to move from guesswork to structured intelligence. Competitor analysis is no longer optional for Amazon sellers; it is a core driver of profitability, with the right tools revealing market share shifts, keyword opportunities, pricing trends, and social chatter before they become visible on Amazon's front end.
Here is how sellers typically fail at this process before finding a system:
The Competitive Clarity System is structured to fix each of those failure points.
Amazon competitor analysis is the ongoing process of identifying, monitoring, and drawing strategic insights from the sellers, listings, and advertising behaviors that compete for the same shopper attention you are targeting. This analysis helps sellers understand how competitors position themselves in the market, their pricing strategies, the keywords they rank for, and how well their listings perform. The definition is simple; the execution is where most sellers fall short.
The market context in 2026 makes this work more urgent than ever. Amazon registered approximately 165,000 new sellers in 2025, the lowest annual number in a decade and a 44% decline compared to 2024, reflecting rising advertising costs, higher platform fees, and stronger competition that make launching a profitable Amazon business more challenging than it was several years ago. What this means for existing sellers is that remaining competitors tend to be better-capitalized, more experienced, and more data-driven. Knowing exactly who they are and how they operate is fundamental to staying ahead.
New seller registrations hit a decade low of 165,000 in 2025, down 44% from the 2020 peak. The marketplace is top-heavy: the top 1% of sellers capture about 27% of total revenue. For sellers in competitive categories, that concentration means ignoring the top tier is not a viable strategy.
Key reasons to run structured competitor analysis now:
The Competitive Clarity System is a sequential, repeatable process that runs on a monthly cycle. Each step builds on the previous one, moving from identification through action. This is the primary framework used throughout this article, and it is referenced whenever a tactic connects back to a specific step.
Most sellers define their competition too broadly. The relevant competitive set for any product is the group of ASINs that rank in the top 20 organic results for your three highest-converting keywords. To get the most out of competitor analysis tools, identify main competitors by searching target keywords and noting the best-performing listings, then analyze sales history with tools like Helium 10 or Jungle Scout to study trends and demand. Run this exercise on your primary keyword and your two strongest secondary keywords. The overlap between those three lists gives you your core competitive set, typically five to twelve ASINs.
For each competitor in your core set, build a structured profile. An effective competitor analysis should compile revenue over time, sales over time, estimated fees, number of active sellers, review count, and review velocity — then cross-reference the keywords a competitor's listing ranks for using reverse-ASIN research. This profile becomes your living comparison document, updated monthly.
Key items in a listing intelligence profile:
This is the step the Competitive Clarity System most distinguishes from a one-time audit. The most valuable piece of information in the Search Query Performance report is first-party data from Amazon on search volume and your brand's share of that search volume, including the Search Query Score that shows which queries drive the most sales.
The Search Query Performance dashboard shows data for impressions, clicks, cart adds, and other sales metrics for specific queries and provides a breakdown of your brand's share of performance compared to overall query performance in the Amazon store — including the percentage of clicks for your brand's catalog compared to the total count for all brands. When you know your impression share for a keyword, you can calculate exactly how much opportunity you are leaving to competitors.
Steps for share-of-voice analysis:
Reviews are structured competitive intelligence, not just social proof. Sentiment analysis of customer reviews reveals how shoppers feel about competitor products, uncovering weaknesses you can address in your own listing or product development roadmap. Specifically, scan the one- and two-star reviews of your three closest rivals for recurring themes. If three different competitor reviews mention the same pain point, that is a product differentiation signal.
Stack Influence's internal campaign data shows that Amazon sellers who systematically mine competitor reviews for product and messaging gaps before running micro influencer campaigns see significantly higher content relevance scores than sellers who brief creators based on internal assumptions alone. Review mining reveals the actual language customers use, which makes creator briefs sharper and product claims more credible.
When analyzing the keywords a competitor is targeting in their PPC campaigns, look for trends — for example, if a competitor is targeting many third-party seller brand names, that same keyword list can inform your own video ad strategy. Beyond on-platform PPC, watch for signs that a competitor is building external traffic. Check whether their Amazon storefront has been recently updated, whether they are running a Brand Store with curated editorial content, and whether their organic search rankings shift in ways that suggest off-platform traffic boosts to the A9 algorithm.
The Competitive Clarity System completes its cycle here. Every month, steps 1 through 5 produce a data set that feeds directly into listing optimization, ad strategy, and product development decisions.
Here is the specific belief this section challenges: most Amazon sellers treat competitor analysis as a keyword and pricing exercise. They assume that if they match or undercut rivals on price and rank for the same terms, the competitive problem is solved.
More than 60% of the top 10,000 Amazon sellers registered before 2019, and veterans control the top slots. The top 2% of sellers generate over 50% of total third-party revenue in the U.S. — revenue is concentrating at the top while the long tail shrinks. These sellers are not winning on price. They are winning on brand infrastructure: storefronts, A+ Content, external traffic flywheels, and review moats built over years.
The specific alternative metric most guides skip is share-of-voice trajectory, not share of voice at a single point in time. A competitor with 8% click share on your primary keyword is not the same threat as a competitor who has moved from 4% to 8% in ninety days. The trajectory matters far more than the snapshot. In Amazon's Search Query Performance dashboard, tracking impression share for top 10 to 20 keywords as a trend over time is a clear sign of capturing or losing market share.
The actionable replacement this week: open your Search Query Performance dashboard, pull data for your top ten keywords over the past three months, and build a simple trend line for your click share per term. Any term where a competitor is gaining more than two percentage points per month is a keyword defense priority, not a launch opportunity.
From Stack Influence's experience running Amazon seller influencer campaigns, sellers who track share-of-voice trajectory monthly and connect competitor SOV gains to their own listing response times outperform peers by a measurable margin in share recovery after competitive disruptions.
The Competitive Clarity System operates inside Amazon's ecosystem. But the most overlooked competitive lever for Amazon FBA sellers is external traffic, specifically the structural advantage it creates in both organic ranking and unit economics. Amazon has been rewarding sellers who direct off-Amazon traffic to their listings with higher search rankings, helping sellers track their off-Amazon sales through Amazon Attribution. This means competitive intelligence that reveals a rival building external traffic is a signal to respond with your own off-platform investment, not just a note to file away.
Social media posts featuring user-generated content drove 10.38 times higher conversion rates compared to non-UGC posts, according to Emplifi's Q3 2025 Social Media Benchmarks report. For Amazon sellers using micro influencer product seeding to generate UGC, this creates a compounding advantage: the content improves Amazon listing conversion rates while simultaneously driving external traffic that the A9 algorithm rewards with organic ranking gains.
The Amazon solutions for brands that connect micro influencer campaigns directly to Amazon storefronts unlock the full loop: creator content drives external traffic, Attribution tags credit the sale, and the Brand Referral Bonus offsets part of the referral fee on every attributed conversion.
Here is how to build the external traffic layer into your competitive response:
Across campaigns managed on the Stack Influence platform, Amazon sellers who pair micro influencer traffic campaigns with a structured share-of-voice tracking cycle see measurable organic rank improvements on targeted keywords within 45 to 60 days of campaign completion, particularly in sub-categories where organic rankings are sensitive to conversion velocity.

Beyond the monthly Competitive Clarity System cycle, there is a separate process that applies specifically before launching a new product or entering a new subcategory. This is the Pre-Launch Competitive Audit, a named checklist framework designed to confirm market viability before investment.
The Pre-Launch Competitive Audit has six items:
The Pre-Launch Competitive Audit is distinct from the Competitive Clarity System in scope and timing. The Audit runs once before entry. The System runs monthly for active listings. Both are required for sellers who operate in competitive sub-categories.
Tracking competitor activity without a structured measurement model creates data noise. The Market Position Stack is the named metric model for this article, and it defines the four numbers that together signal whether a brand is gaining or losing competitive ground.
The Market Position Stack has four components:
These four numbers together give a complete picture: organic visibility, social proof trajectory, external traffic efficiency, and cost structure impact. No single number tells the full story. The Market Position Stack is designed to be reviewed alongside the Competitive Clarity System output each month.
Brands using the influencer seeding workflows that generate ongoing UGC should also track the volume of creator content that features Amazon storefront links, since each tagged piece of content contributes to Attributed Traffic Conversion Rate in the Market Position Stack.
Competitive intelligence is only useful if it connects to decisions. The final step in applying the Competitive Clarity System is building a workflow that converts monthly analysis into a concrete action list.
Based on Stack Influence's work with eCommerce brands managing ongoing Amazon competitor analysis, sellers who assign each of the five Competitive Clarity System steps to a specific team member or role and set a fixed monthly review date act on insights three times faster than sellers who treat competitor research as an ad-hoc project.
A practical workflow structure looks like this:
This weekly structure keeps the Competitive Clarity System alive without overwhelming operations. Each week's work takes between 45 minutes and two hours depending on category size and the number of ASINs tracked.
For sellers exploring UGC and product seeding strategies as a response to competitor differentiation, the pre-launch Competitive Audit should identify whether UGC content volume is a gap among existing competitors — if it is, it becomes the highest-leverage action in the campaign plan. To explore how micro influencer campaigns for Amazon sellers can feed directly into your competitive intelligence cycle, review the platform-specific workflows designed for Amazon brand owners.
Amazon competitor analysis is not a research project. It is an operating discipline that separates sellers who grow market share deliberately from those who discover they have lost it too late to respond. The Competitive Clarity System gives eCommerce sellers a five-step monthly process for building and acting on competitive intelligence. The Pre-Launch Competitive Audit adds a structured entry-gate before any new product investment. The Market Position Stack gives sellers four numbers that together show whether competitive momentum is moving in their favor. When paired with Amazon Attribution tracking, the Amazon Brand Referral Bonus, and external traffic strategies built around the same keyword opportunities the analysis reveals, these frameworks compound into a durable competitive advantage. The sellers winning in 2026 are running systems, not gut checks.
Video is no longer a nice-to-have for eCommerce sellers. Shoppers who watch a product video before purchasing convert at dramatically higher rates, stay on page longer, and return less often. Yet most sellers still treat video as a creative expense rather than a revenue channel. This guide breaks down six specific video commerce tactics you can deploy to turn passive viewers into paying customers, whether you sell on Shopify, Amazon, or both. After coordinating product seeding campaigns at scale, Stack Influence's data shows that brands using video at multiple funnel stages consistently outperform those using it only at the top of the funnel.
Most sellers approach video commerce backwards. They produce a polished brand video, publish it once, and wait for the views to roll in. The problem is that a video nobody interacts with is just expensive wallpaper. A real video commerce strategy maps each video type to a specific buyer action.
Start by matching your video format to your funnel stage:
The goal is to ensure a shopper can encounter your brand through video, deepen their interest through video, and complete a purchase through video without ever needing to seek out additional information elsewhere. This is the core principle of the PACE Framework introduced later in this article. Stack Influence's integration into this approach is straightforward: brands using micro influencer promotions to fuel the discovery and consideration stages spend far less on paid acquisition because creator video content does the heavy lifting across all four stages simultaneously.
Video commerce is the practice of embedding purchasing capability directly into video content, or using video as the primary driver of the path to purchase. It is broader than simply adding product links to a YouTube description. Video commerce encompasses shoppable videos with in-player buy buttons, live commerce events where hosts sell in real time, short-form social commerce on TikTok Shop, and UGC video deployed on product pages to reduce buyer hesitation.
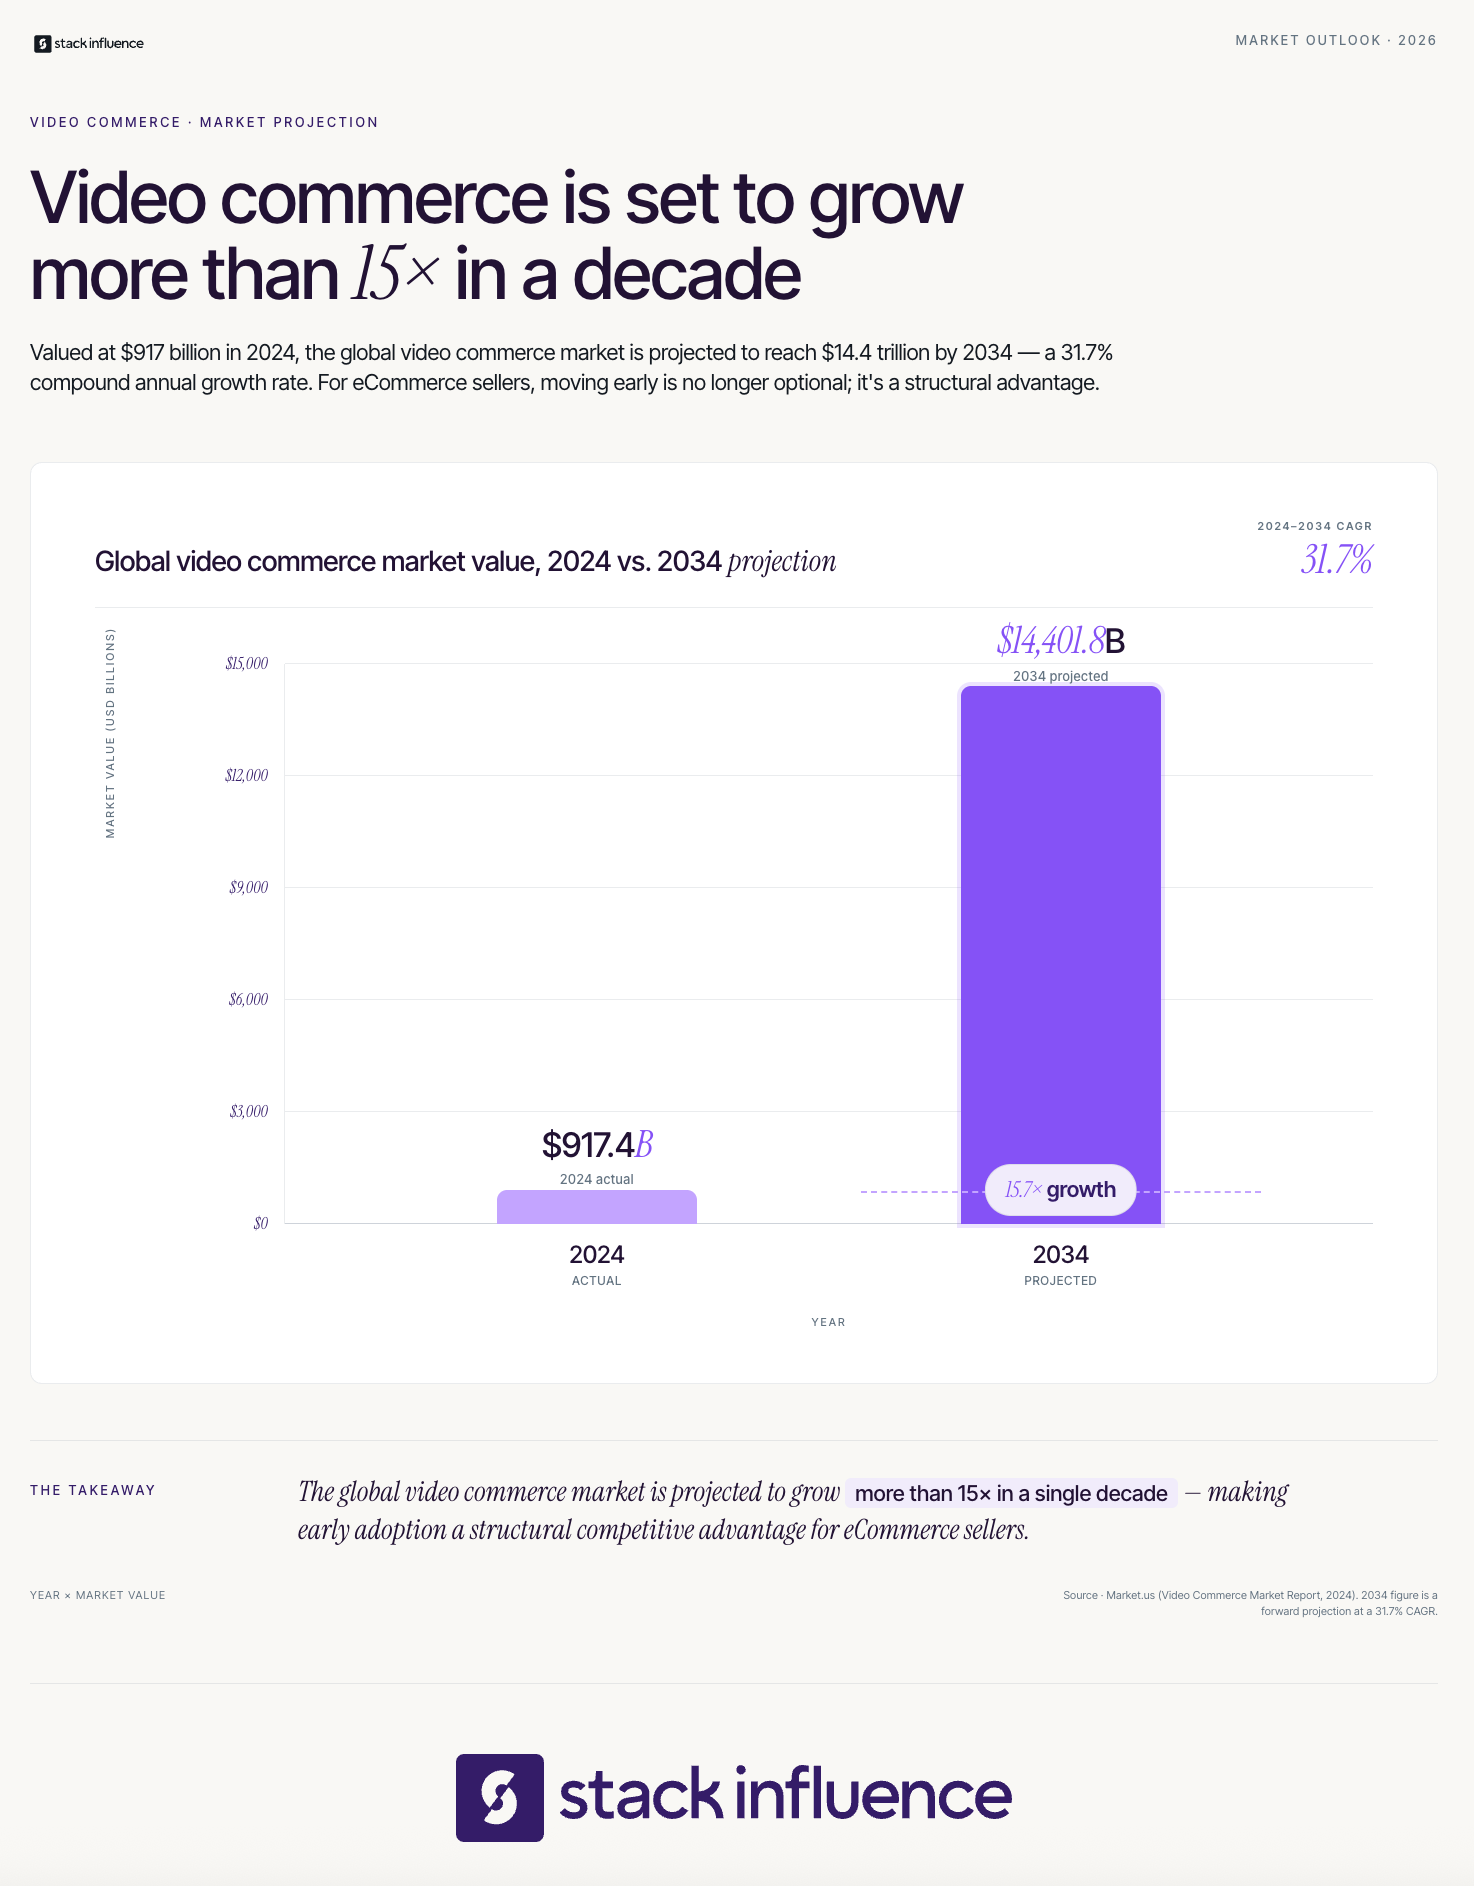
According to market research from Market.us, the global video commerce market is projected to grow from USD 917.4 billion in 2024 to USD 14,401.8 billion by 2034, a CAGR of 31.7%. That growth rate is not driven by a single platform or format. It reflects a structural shift in how consumers prefer to encounter and evaluate products. The key formats within video commerce include:
Understanding these four formats is the foundation for applying the PACE Framework, which gives each format a specific role in your revenue strategy.
The PACE Framework is a branded four-stage system designed to help eCommerce sellers build a scalable video commerce operation. PACE stands for Place, Activate, Calibrate, and Expand. Each stage has a specific deliverable, and the framework is designed to be used sequentially before any budget is increased.
Data from Whatmore's controlled A/B tests across 200,000+ sessions shows that visitors who engage with a shoppable video convert at a median rate 125% higher than those who do not. The reason most sellers never unlock that lift is that they skip straight to production without completing the first two PACE stages.
Here is how each stage of the PACE Framework works:
According to Firework's performance data, 84% of consumers report being convinced to purchase a product after watching a brand's video, and viewers engaged with shoppable videos show a 9x increase in purchase intent. That kind of intent signal only activates when the video content feels credible, which is why the Activate stage of the PACE Framework specifically calls for creator-generated rather than brand-produced content.
A 2026 benchmark study from ReelTok found that shoppable videos outperform static images in driving conversions by 25% to 80%, while keeping users engaged for an average of 1 minute and 34 seconds per session. When you apply the PACE Framework systematically, those numbers become achievable benchmarks rather than outliers.
The most common bottleneck in video commerce is not strategy or platform. It is content volume. A seller who wants to run shoppable video on fifty product pages needs a reliable, repeatable source of video content that does not require a film crew for every SKU. The solution is a structured asset engine, built using the Video Source Audit.
The Video Source Audit is the secondary framework in this guide. It is a five-point checklist that helps sellers identify and organize every source of video content already available to them before spending a dollar on new production.
According to published marketing research, 81% of ecommerce marketers say UGC has a greater impact than professional product photography. The implication is significant: your most powerful video assets may already exist in your customers' hands.
Here is how to run the Video Source Audit:
Research compiled by loop.fans shows that UGC-enabled product pages generate 161% higher overall conversion rates than pages without UGC, and for a business doing $1M in monthly revenue, this can represent the difference between $1M and $3.7M driven entirely by content customers created.
The Video Source Audit should be completed before the PACE Framework's Activate stage begins. Running the audit first prevents redundant production spend and ensures your Calibrate stage has a diverse enough mix of video types to produce statistically meaningful results.
From Stack Influence's experience running product seeding campaigns for eCommerce brands, micro influencer campaigns in the health, beauty, and home categories generate an average of 12 to 18 usable UGC video clips per 10 seeded units, giving sellers a ready-made library that can populate shoppable video widgets, paid social ads, and Amazon listing galleries within a single campaign cycle.
Amazon sellers have a specific video commerce opportunity that DTC brands often overlook. Amazon's algorithm rewards listings that include video with better placement, higher organic rank, and improved conversion rate on the product detail page. The three surfaces where video creates measurable lift for Amazon sellers are the main listing video slot, Amazon Posts, and the Amazon Influencer Program storefront.
Marketplaces like Amazon increasingly favor listings with video through better placement and higher conversion rates, and sellers without video lose visibility and sales to competitors who invest in video content. The combination of the Amazon Brand Referral Bonus and Amazon Attribution means that external video traffic driven by creator content can earn sellers a credit of 10% on attributed sales, directly reducing customer acquisition cost.
Here are the three Amazon video commerce tactics that create the most measurable lift:
Charm.io's data shows U.S. TikTok Shop monthly GMV grew from $15.1 million in July 2023 to $1.1 billion in July 2025, and global GMV since launch has passed $70 billion. For Amazon FBA sellers, this growth signals that video-first discovery on social platforms now drives halo demand back to Amazon listings. Brands that coordinate TikTok Shop creator activity with Amazon Attribution can measure exactly how much external video traffic converts to marketplace sales through the 14-day Amazon Attribution lookback window.
Across campaigns managed on the Stack Influence platform, Amazon sellers who pair product seeding with Amazon Attribution tracking consistently see a 15% to 25% lift in branded search volume within 60 days of campaign launch, a signal that video commerce on social platforms creates measurable demand that flows directly back to their Amazon listings.
Most sellers track view count and engagement rate for their video content. Both metrics are directionally useful but operationally insufficient. The RAVEL Metric Model is a five-component measurement framework designed specifically for eCommerce video commerce, focused entirely on revenue outcomes rather than vanity signals.
RAVEL stands for: Revenue per Session, Add-to-Cart Rate, View-to-Click Rate, Engagement Depth, and Lift Attribution. Each component connects directly to a stage of the purchase funnel.
According to published data, TikTok Shop's US GMV reached approximately $13.2 billion in 2025, up 87% year over year, with pre-recorded creator videos driving about two-thirds of all platform sales. That last data point matters for how you design the RAVEL model for social commerce specifically. On TikTok Shop and similar platforms, VCR and Lift Attribution are most easily tracked through creator affiliate links and platform analytics, while RPS requires a unified reporting layer across channels.
Stack Influence's internal campaign data shows that eCommerce brands who implement the RAVEL Metric Model within the first 30 days of a video commerce launch make optimization decisions 40% faster than brands who wait to establish measurement after scaling, because they catch low-performing video placements before compounding spend on them.
To apply the RAVEL Metric Model, set up your analytics before you publish a single video. Track RAVEL components at the SKU level, not just the page level, so you can identify which specific products benefit most from video and prioritize the PACE Framework's Expand stage accordingly. Use the model name as a shared reference in team reporting so that every stakeholder uses the same five metrics to evaluate performance.

The most commonly held belief in eCommerce video strategy is that production quality determines conversion rate. Sellers spend significant budget on cinematic product videos, assuming that polish equals persuasion. The data contradicts this assumption directly.
According to SellersCommerce, 78% of people say they would most like to learn about a product by watching a short video, compared to just 9% who prefer text-based articles, an 8.6x preference gap that makes the case for video overwhelming. But the format people prefer is not brand-produced advertising. It is authentic, creator-native content that mirrors how they already consume video on TikTok, Instagram, and YouTube.
Edelman's 2025 Trust Barometer found that 80% of consumers now look to peers rather than brand experts as the gold standard for accurate brand information, and Forrester research shows 68% of consumers identify UGC as the most authentic content format, up from 60% the previous year. This creates a direct challenge for sellers who invest heavily in studio-quality brand videos: they are optimizing for a production standard that consumers actively discount.
The specific belief to abandon is this: "A better-looking video will convert better." The alternative, supported by the data, is: "A more believable video will convert better." Here is what that shift looks like in practice:
The actionable step this week is a direct swap on your top product page. Take down one brand-produced video and replace it with a UGC clip from a creator in your category. Track add-to-cart rate for 30 days using the RAVEL model. The data will tell you whether the contrarian position is correct for your specific audience.
Data from Stack Influence's micro influencer campaigns suggests that brands who prioritize UGC video over branded production for their on-site video content see, on average, 20% to 35% higher engagement depth scores compared to polished brand videos on the same product pages, because shoppers are trained by social platforms to trust the creator format over the commercial format.
Video commerce is not a single tactic. It is a system that connects content, creator partnerships, platform placement, and revenue measurement into a unified growth engine. The six tactics covered in this guide, ranging from funnel-stage mapping through the PACE Framework to asset sourcing with the Video Source Audit and performance tracking with the RAVEL Metric Model, give eCommerce sellers a complete, repeatable operating model.
The opportunity is significant regardless of whether you sell on Shopify, through Amazon FBA, or direct to consumers through your own site. Sellers who treat video commerce as an integrated revenue strategy rather than a content project will consistently outperform those who treat it as a creative exercise. Apply the PACE Framework to your top three product pages this week, run the Video Source Audit to find the content you already have, and implement the RAVEL Metric Model before you publish a single video. The sellers who measure first and scale second are the ones who sustain the gains.
The average influencer marketing budget for US-based brands will reach $9.29 billion in 2025, a 14.2% increase from the year prior, according to Shopify's influencer marketing statistics report. Despite this surge, many eCommerce sellers lose campaign value before a single video is posted, not because they picked the wrong creator, but because they wrote a weak brief. The brief is the operational handshake between your brand strategy and the creator's creative instincts. Get it wrong and you burn product, time, and budget on content that goes nowhere.
For most of the last decade, the influencer brief was treated like a compliance checklist. Brands listed required hashtags, FTC disclosure language, and a vague directive to "be authentic." That approach no longer matches the market. According to data from the Sprout Social 2025 Influencer Marketing Report, 65% of influencers prefer joining strategy development conversations with brands early on rather than following a rigid brief. This signals something important: a brief that functions like a legal agreement will consistently produce lower-quality content than one that functions like a creative partnership document.
The shift in 2026 is directional. Brands are moving away from scripted briefs packed with mandatory phrases and toward input-based briefing, where creators receive angles, proof points, and outcome goals rather than a word-for-word script. A great brief does something rarer: it gives structure without killing life. The cleanest way to do that is to brief creators on inputs, not scripts, then give them options including angles, hooks, and proof points, so they can still perform it like a human.
This is especially critical for eCommerce brands working with micro influencers, where the creator's relatability is the entire asset. Over-scripting strips away the very quality you paid for.
Here is what has practically changed in brief strategy this year:
Brands still running 2020-era briefs in 2026 are essentially funding content that entertains without converting.
An influencer brief is a structured document that communicates your campaign goals, deliverable requirements, creative guardrails, and measurement expectations to a creator before they begin producing content. An influencer brief is a comprehensive document that outlines your campaign expectations, deliverables, and guidelines for creators. Think of it as your campaign's blueprint — it sets clear expectations between your brand and influencers, ensuring everyone understands the goals, requirements, and success metrics. A strong influencer campaign brief eliminates confusion, reduces revision rounds, and helps creators produce content that aligns with your brand's voice and objectives.
For eCommerce sellers specifically, the brief serves an additional function: it is a sourcing document for reusable UGC. When a creator produces a well-briefed video for your Shopify product page or Amazon storefront, that same asset can become a paid ad, a product detail page video, or an email creative. Power Reviews found that 9 in 10 consumers are more likely to buy a product that has photo and video reviews. In an analysis of 1,200 websites, Statista reports that the average conversion rate with just UGC present on a product page was around 3.2%, and that rate jumped 102% when users engaged with the UGC. That kind of conversion lift only happens when the brief produces content worth reusing.
For Amazon sellers running product seeding campaigns, the brief is also where you specify your Amazon Attribution link, the unique tag that lets Amazon track which sales came from external influencer traffic. By providing influencers with your specific Amazon Attribution links, you can track exactly which creator is driving the most profitable sales and scale your partnerships accordingly.
The brief is where your campaign begins, not where the creator's job begins.
The primary framework for this guide is the Brief Tier Model, a three-stage structure that calibrates how much instruction you give a creator based on the type of campaign and your relationship stage with that creator. Most brands write the same brief for every creator at every stage, which is why they get inconsistently performing content across their roster. The Brief Tier Model solves this.
Tier 1 applies to nano influencers (creators with under 10,000 followers) and micro influencers you have never worked with before. These creators do not need a dense document. They need enough context to represent your brand accurately. Keep the Tier 1 brief to one page or fewer, and focus it entirely on who your customer is, what the product does for them, and one or two non-negotiable content requirements.
Instagram nano-influencers deliver 6.23% average engagement rates, the highest of any influencer tier on the platform. These creators maintain intimate relationships with their audiences, generating trust that translates to meaningful engagement. That trust is fragile and evaporates the moment a creator sounds scripted. A Tier 1 brief protects it.
Tier 1 essentials:
Stack Influence's internal campaign data shows that product seeding campaigns using context-level briefs with fewer than 200 words generate significantly higher on-time creator submission rates than campaigns with dense, multi-page briefs, because shorter briefs reduce creator friction without sacrificing alignment on the critical brand message.
Tier 2 applies to micro influencers you have worked with at least once before and mid-tier creators with 50,000 to 250,000 followers. These creators have earned a degree of creative latitude through demonstrated brand alignment. Your brief should still provide clear guardrails, but it should add a hook framework and competitive context.
Tier 2 additions beyond Tier 1:
From Stack Influence's experience running product seeding campaigns at scale, eCommerce brands that build hook options into their Tier 2 briefs see measurably higher first-draft approval rates than brands that leave hook selection entirely to the creator, because hooks grounded in product truth consistently outperform hooks generated purely from creator instinct.
Tier 3 is reserved for brand ambassadors, brand partnerships, and macro creators who are embedded in your broader content strategy. At this level, the brief becomes a co-creation document. The creator participates in shaping the campaign direction. You bring the business objective; they bring the audience insight.
Transactional, one-off influencer campaigns are losing steam. Expect more brands to transition from short-term sponsorships to ambassadorship models. In 2025, agencies should focus on long-term collaborations that build deeper affinity and loyalty.
Tier 3 additions beyond Tier 2:
Reference the Brief Tier Model when onboarding new creators to determine which tier their brief should occupy before you write a single word.
The secondary framework is the Creator-Ready Brief Checklist, an eight-item audit that works independently of the Brief Tier Model. Before you send any brief at any tier, run it against this checklist. A brief that passes all eight items will arrive camera-ready for the creator.
This checklist is designed for eCommerce brands running influencer campaigns at any scale, from a single-SKU Amazon FBA seller testing product seeding for the first time to a DTC brand managing dozens of active content creators.
The Creator-Ready Brief Checklist:
Run the Creator-Ready Brief Checklist on your last three briefs right now. Most eCommerce sellers discover they have been consistently missing the hook scaffolding and creative permission statement items, which explains persistent revision cycles and stilted-sounding content.
A well-constructed brief is only valuable if you can trace it to outcomes. Most eCommerce sellers stop at engagement rate, which is a useful diagnostic but an incomplete picture. This section introduces the Brief-to-Revenue Metric Stack, a four-component measurement model that tracks brief quality through to bottom-line impact.
Reports show that 91% of brands using influencer marketing see creator content driving more ROI than traditional digital ads, yet most brands lack the measurement architecture to tell which part of the campaign produced that ROI. The Brief-to-Revenue Metric Stack closes that gap.
The four components of the Brief-to-Revenue Metric Stack are:
When customers arrive via Amazon Attribution links and make purchases, sellers earn an average 10% bonus on those sales, effectively reducing referral fees. The Amazon Brand Referral Bonus is a rewards program that gives enrolled brands a bonus on sales generated when shoppers reach an Amazon listing through the brand's own external marketing. Include your Amazon Attribution link and the Brand Referral Bonus credit in the Attributed Revenue per Creator calculation to understand the true economics of each creator partnership.
Across campaigns managed on the Stack Influence platform, eCommerce brands that define Attributed Revenue per Creator as a primary KPI before the campaign launches make optimization decisions significantly faster than brands that retrofit attribution after content has already posted, because retroactive attribution consistently misses purchases that close within the 14-day window but after the creator's post drops off algorithmic feeds.
Apply the Brief-to-Revenue Metric Stack as a campaign debrief document, not just a live dashboard. The real value is comparing your First-Draft Approval Rate and Engagement-to-Conversion Rate across multiple creators to identify which brief tier is producing your best content.
One underappreciated decision for eCommerce sellers is where brief creation and creator management should live. Building a brief template in-house gives you creative control and institutional knowledge. Working through an influencer marketing platform or a micro influencer agency accelerates your workflow and gives you access to vetted creator pools with historical performance data.
Brief development is cited by 13.89% of marketing teams as a specific use case for AI tools, showing that many teams are using AI to accelerate campaign setup, create more creative variants, and shorten production cycles. Even with AI assistance, the brief strategy itself requires human judgment about your brand's voice, your product's truth, and your customer's motivations.
For Amazon sellers specifically, the decision matrix is different. An Amazon-native seller often needs creators who understand how to drive external traffic that converts on a product detail page rather than a brand website. TikTok and influencer marketing allow brands to leverage creators in their niche to demonstrate products in action. By providing influencers with specific Amazon Attribution links, brands can track exactly which creator is driving the most profitable sales and scale their partnerships accordingly.
Here is how to decide where brief management should live for your brand:
Based on Stack Influence's work with eCommerce brands across product seeding and ambassador programs, sellers who standardize their brief template before scaling their creator count consistently experience fewer off-brief deliverables and shorter approval cycles than brands that customize briefs individually for each creator at scale.
For Shopify sellers building influencer programs, embedding UTM parameters and post-click landing page destinations in the brief at the outset removes the most common bottleneck in post-campaign attribution, which is creators sharing untracked links because the brief never specified which URL to use.

The Brief Tier Model and the Creator-Ready Brief Checklist work together to shape your brief structure. But abstract frameworks only go so far. Here is the operational anatomy of a high-performing brief for an eCommerce brand, built on the principles in this article.
A winning brief for a micro influencer campaign includes each of the following in sequence:
Over 85% of consumers trust UGC more than branded content, and they are significantly more likely to buy products featuring real customer experiences. That trust advantage is only realized when the brief preserves the creator's authentic voice. Every element of a high-performing brief either delivers necessary clarity or explicitly protects creative freedom. If an element does neither, cut it.
For brands looking to understand the niche micro influencer advantage and how to activate it systematically, the brief is the activation mechanism. The creator is the amplifier. Your brief determines what gets amplified.
Learning how to brief an influencer is not a one-time task. It is an operational capability that compounds over time. Every campaign you run produces data about what your audience responds to, what content formats work on each platform, and which creative angles drive conversions. The Brief Tier Model gives you a scalable structure to carry those learnings forward into every future activation. The Creator-Ready Brief Checklist ensures you never send an incomplete brief again. And the Brief-to-Revenue Metric Stack gives you the measurement language to prove brief quality in business terms. Start by auditing your most recent brief against the Creator-Ready Brief Checklist. Identify which items are missing, update your template, and run your next campaign with a Tier 1, Tier 2, or Tier 3 brief matched to the right creator type. Knowing how to brief an influencer effectively is the single most controllable variable in your influencer campaign performance, and it costs nothing to improve.
The loudest advice circulating in creator communities right now tells you to chase open rates, post on a rigid schedule, and treat your Substack like a funnel. That framing misses the most important strategic shift happening in 2026: content creators who treat Substack as a standalone publishing tool are leaving serious money on the table. Creators who treat it as an audience ownership engine — one that feeds brand partnerships, UGC opportunities, and direct revenue — are building businesses that compound.
The gap between those two approaches is not about effort. It is about understanding what the platform actually rewards, and what the numbers say about where creator income is concentrated. This article gives you the strategic framework, the right metrics, and a clear-eyed view of the common misconceptions that keep most creators stuck below their earning potential.
Substack is a subscription-based publishing platform that allows content creators to publish newsletters, audio, and video directly to subscriber inboxes and earn money through paid subscriptions, brand deals, and digital products. Unlike algorithmic social media platforms, Substack delivers your content directly to opted-in readers with no feed competition. Writers retain ownership of their subscriber list and all content, which is a structural advantage that no social platform offers.
Bestwriting's 2026 Substack statistics report that nearly 100,000 publications earn money globally on Substack as of April 2026, up from 50,000 in May 2025. That doubling happened in under a year, signaling that monetization on the platform is accelerating sharply. According to Backlinko's Substack statistics report, the platform has more than 5 million paid subscriptions, a figure that has more than doubled since 2024.
The creator economy context matters here. The platform sits inside a broader ecosystem where UGC creators, micro influencers, and nano influencers are diversifying income across social media, product seeding campaigns, brand partnerships, and now newsletter businesses. Substack is not a replacement for those revenue streams. It is the anchor asset that makes all of them more valuable by giving you a direct, owned channel to your most engaged audience.
Here is why the platform is specifically powerful for creators rather than just journalists:
For creators serious about building sustainable income from influencer campaigns, Substack gives you the one asset that influencer marketing platforms, brand ambassadors programs, and UGC platforms cannot provide on their own: a direct line to your most loyal audience that you control entirely.
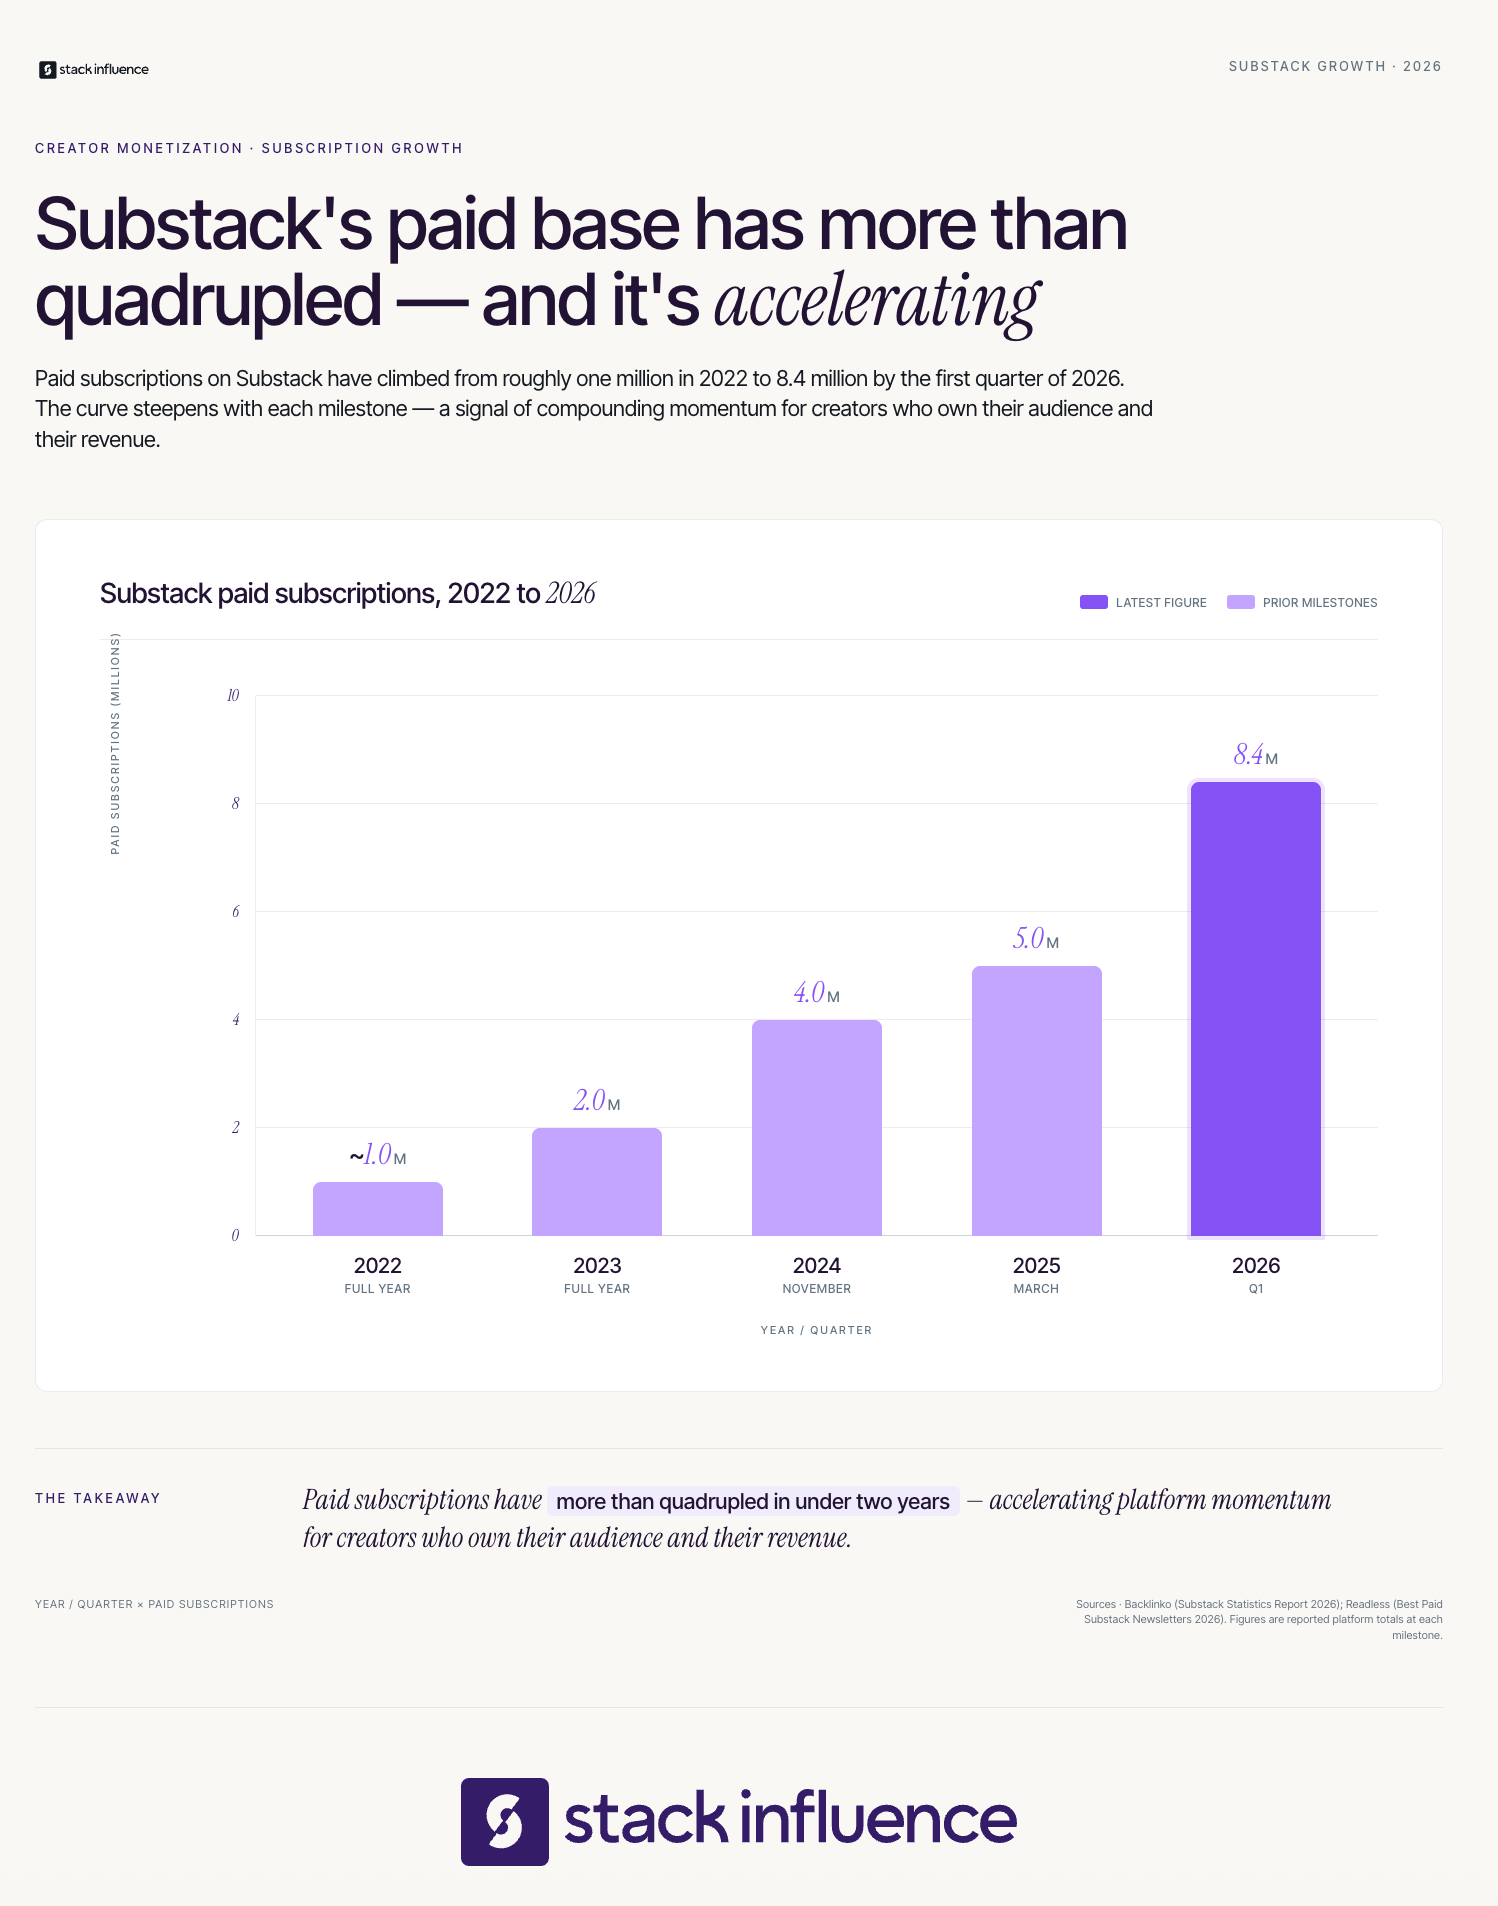
Before publishing your first issue or before your next growth push, every creator should run through the Creator Newsletter Launch Checklist. This is the primary framework for this article, and it is specifically designed to prevent the most common errors that cause Substack newsletters to stall in the first 90 days. Return to this checklist any time you add a new content format, change your niche focus, or launch a paid tier.
The Creator Newsletter Launch Checklist has six items:
Bestwriting's 2026 Substack statistics show that email open rates on Substack average 44%, roughly twice the industry standard. That number is the platform's most compelling structural advantage, but it is only valuable if you have subscribers who opted in because of a clear value promise. A high open rate on a vague newsletter produces clicks but rarely converts to paid subscribers or brand deals. Run the Creator Newsletter Launch Checklist before you scale your audience acquisition efforts.
Stack Influence's internal campaign data shows that creators who build their Substack around a single defined audience persona and pair it with micro influencer content campaigns consistently acquire paid subscribers at lower cost-per-subscriber than those running general-interest newsletters with no defined niche. The specificity of the niche is the variable that drives both paid conversion rates and the quality of the brand sponsorship inquiries the creator receives.
Most guides treat Substack as a monetization tool in isolation, coaching creators to focus entirely on paid subscription growth. The underrated play in 2026 is using your Substack audience as a credibility and targeting signal when pitching brand deals, brand ambassadors programs, and influencer campaigns. A newsletter with 3,000 highly engaged subscribers in a specific niche is more persuasive to a brand than 30,000 social followers with diffuse interests.
According to the InboxReads sixth annual State of Newsletters report via ppc.land, 77% of newsletters indicated interest in sponsorships and advertising partnerships in 2025, up from 72% the prior year. That figure reflects the direction of creator monetization as a whole: brand deals and newsletter sponsorships are converging. Brands looking for influencers with owned-audience reach are beginning to evaluate newsletter metrics alongside social media metrics when selecting partners.
Data from Lumanu's 2025 influencer compensation report shows that micro influencers brought home an average of $38,500 in 2025, with brand partnerships accounting for $500 to $2,000 per post. A creator who supplements social-media-based brand deals with newsletter sponsorship revenue can meaningfully close the income gap between micro and mid-tier creator earnings without needing to grow their social following at all.
From Stack Influence's experience running micro influencer campaigns across consumer eCommerce brands, creators who arrive to a brand partnership pitch with documented newsletter metrics — open rate, subscriber count, niche demographic breakdown — close deals at higher rates and command premium rates compared to creators presenting social metrics alone. The newsletter is the proof-of-audience document that brand deal negotiations have historically lacked.
Here is how to position your Substack as a partnership asset:
For creators participating in product seeding campaigns, a Substack newsletter gives you a second distribution surface to write longer-form reviews and drive brand attribution that goes beyond a single social post. Brands running influencer marketing platforms increasingly value this kind of deep-content amplification because it produces indexable, searchable content that continues driving traffic long after the original post fades.
The secondary framework for this article is the Subscriber Value Tiers, a tiered model that maps your audience based on engagement depth and monetization potential. Unlike follower count metrics on social platforms, Substack gives you behavioral data that makes this segmentation possible and actionable. Reference the Subscriber Value Tiers whenever you are evaluating whether to prioritize subscriber acquisition, paid conversion, or brand deal development.
The Subscriber Value Tiers are structured as three distinct segments:
The Subscriber Value Tiers model works because it replaces vanity subscriber count benchmarking with a segmentation lens that maps directly to revenue actions. Most creators celebrate raw subscriber growth without asking which tier those subscribers belong to. A newsletter adding 200 Tier 3 subscribers per month is growing slower than one adding 40 Tier 1 subscribers per month, even if the headline number looks better. Apply the Subscriber Value Tiers model when you design your content calendar, your upgrade sequences, and your brand partnership pitch materials.
Across campaigns managed on the Stack Influence platform, creators who maintain a healthy Tier 1 to Tier 2 ratio — with at least 1 paid subscriber for every 20 engaged free subscribers — generate significantly stronger brand partnership inquiry rates than those who optimize purely for total subscriber volume. The ratio matters because brands evaluating creators for ambassador and affiliate programs increasingly request engagement data, not just reach data. A smaller, highly tiered audience outperforms a larger undifferentiated one consistently.

Most creators track open rate as their primary newsletter metric. That habit produces misleading data and slow optimization decisions. The correct measurement approach for Substack for creators in 2026 requires a defined model that separates vanity signals from revenue signals. This section introduces the Creator Revenue Metric Stack, your named measurement model for Substack performance.
The Creator Revenue Metric Stack has four components:
According to Beehiiv's State of Paid Newsletters 2026, paid subscription revenue on newsletter platforms hit $19 million in 2025, up 138% from 2024, driven by niche creators delivering specialized expertise. The operational insight from that data is that niche outperforms scale. A creator with 2,000 subscribers in a high-value niche who tracks RPS and SCTR will make faster, better monetization decisions than a creator with 20,000 subscribers who tracks only open rate.
The Creator Revenue Metric Stack complements the Subscriber Value Tiers model by giving you action-triggering numbers for each tier. When PSGR stalls, investigate your Tier 2 to Tier 1 upgrade flow. When RPS drops, audit your paid tier value proposition. When SCTR falls below your baseline, evaluate whether the sponsoring brand is genuinely aligned with your niche. These four metrics together tell the complete story of your Substack business health.
For creators who also run UGC campaigns or participate in influencer marketing campaigns, the Creator Revenue Metric Stack is also a reporting tool. Documenting your SCTR gives you a third-party verifiable benchmark that demonstrates newsletter performance to brand partners. It is the Substack equivalent of a social media engagement rate card, and it belongs in every creator's media kit by 2026.
As reported by ALM Corp's Substack digital marketing guide, Substack publications deliver a 45% open rate in a channel where 21% is considered average. Most guides use this statistic as a celebration. The smarter strategic move is to use it as a benchmark pressure point: if your publication is running below 35%, your niche positioning or content consistency has a problem that no posting schedule hack will fix.
The most common mistake creators make is treating Substack as a second priority — posting on social media first and syndicating content to their newsletter as an afterthought. That approach inverts the revenue logic. Your Substack subscribers are your highest-value audience because they have chosen to receive your content directly. They deserve original, first-priority content, not repurposed social captions. Creators who write for their newsletter first and repurpose to social consistently see higher paid conversion rates and more repeat brand deal inquiries.
The second most common mistake is launching a paid tier too early without a clear paid value proposition. According to Bestwriting's statistics report, 40% of Substack publications are free-only, and many of those creators have not yet identified what their paid subscribers would specifically receive that justifies the monthly cost. Launching a paid tier before that answer is clear produces low conversion rates and high churn — both of which damage your Creator Revenue Metric Stack scores.
Here is the priority sequence for creators at different stages:
For creators interested in building influencer-brand partnerships at scale, the Substack audience is a force multiplier — not a standalone income source. The creators extracting the most value from the platform in 2026 are those who use it to deepen audience relationships that make every other revenue stream more productive. That is the strategic truth that most Substack guides fail to name directly.
Substack for creators is not a monetization shortcut. It is an audience ownership asset that, when built with niche clarity and measured with the right metrics, compounds in value faster than any algorithmic platform. The Creator Newsletter Launch Checklist, the Subscriber Value Tiers model, and the Creator Revenue Metric Stack give you a complete operational system for building, segmenting, and monetizing your newsletter in 2026.
Creators who commit to the platform with a defined niche, a realistic monetization sequence, and the habit of tracking Paid Subscriber Growth Rate and Revenue Per Subscriber alongside brand partnership metrics will find that Substack functions as the connective tissue between their social presence and their business income. The open rate is the invitation. What you do with the attention your subscribers give you is the strategy. Focus there first, and the revenue will follow.
Platform creator funds were supposed to democratize income for content creators. In practice, they have become one of the most expensive illusions in the creator economy. A creator with 500,000 views might check their Creator Fund payout and find $14.80 in earnings. That is the TikTok Creator Fund in 2026, not a typo. The math has never worked for creators building real businesses, and the structural problem is only getting worse.
The fundamental flaw of fixed-pool creator fund models is that the fund has a fixed size while the number of eligible creators and total views keeps growing, meaning per-view payouts actually decline over time as the pool of participants expands. Understanding this dynamic is the first step toward building an income model that does not depend on platform goodwill. This guide maps seven proven creator fund alternatives that content creators at every follower count can activate in 2026.
Creator fund alternatives are income channels that content creators use instead of, or in addition to, platform-native payment pools like TikTok's Creator Fund or Instagram's bonus programs. As of 2026, the creator economy is valued at $234 billion and is expected to surpass $528 billion by 2030 , meaning the opportunity landscape for creators has expanded far beyond anything a platform fund can capture.
According to Influencer Marketing Hub's 2025 creator earnings report, the highest-earning TikTok creators derive less than 20% of their total income from platform funding programs, with brand deals, affiliate marketing, and owned products generating the majority of creator revenue. This is not a niche finding. It reflects a structural reality that most creator fund guides fail to address: the fund is a discovery mechanism, not a business model.
The seven categories of creator fund alternatives covered in this guide are:
Each of these channels operates independently of platform algorithm decisions and pays based on value delivered, not views accumulated.
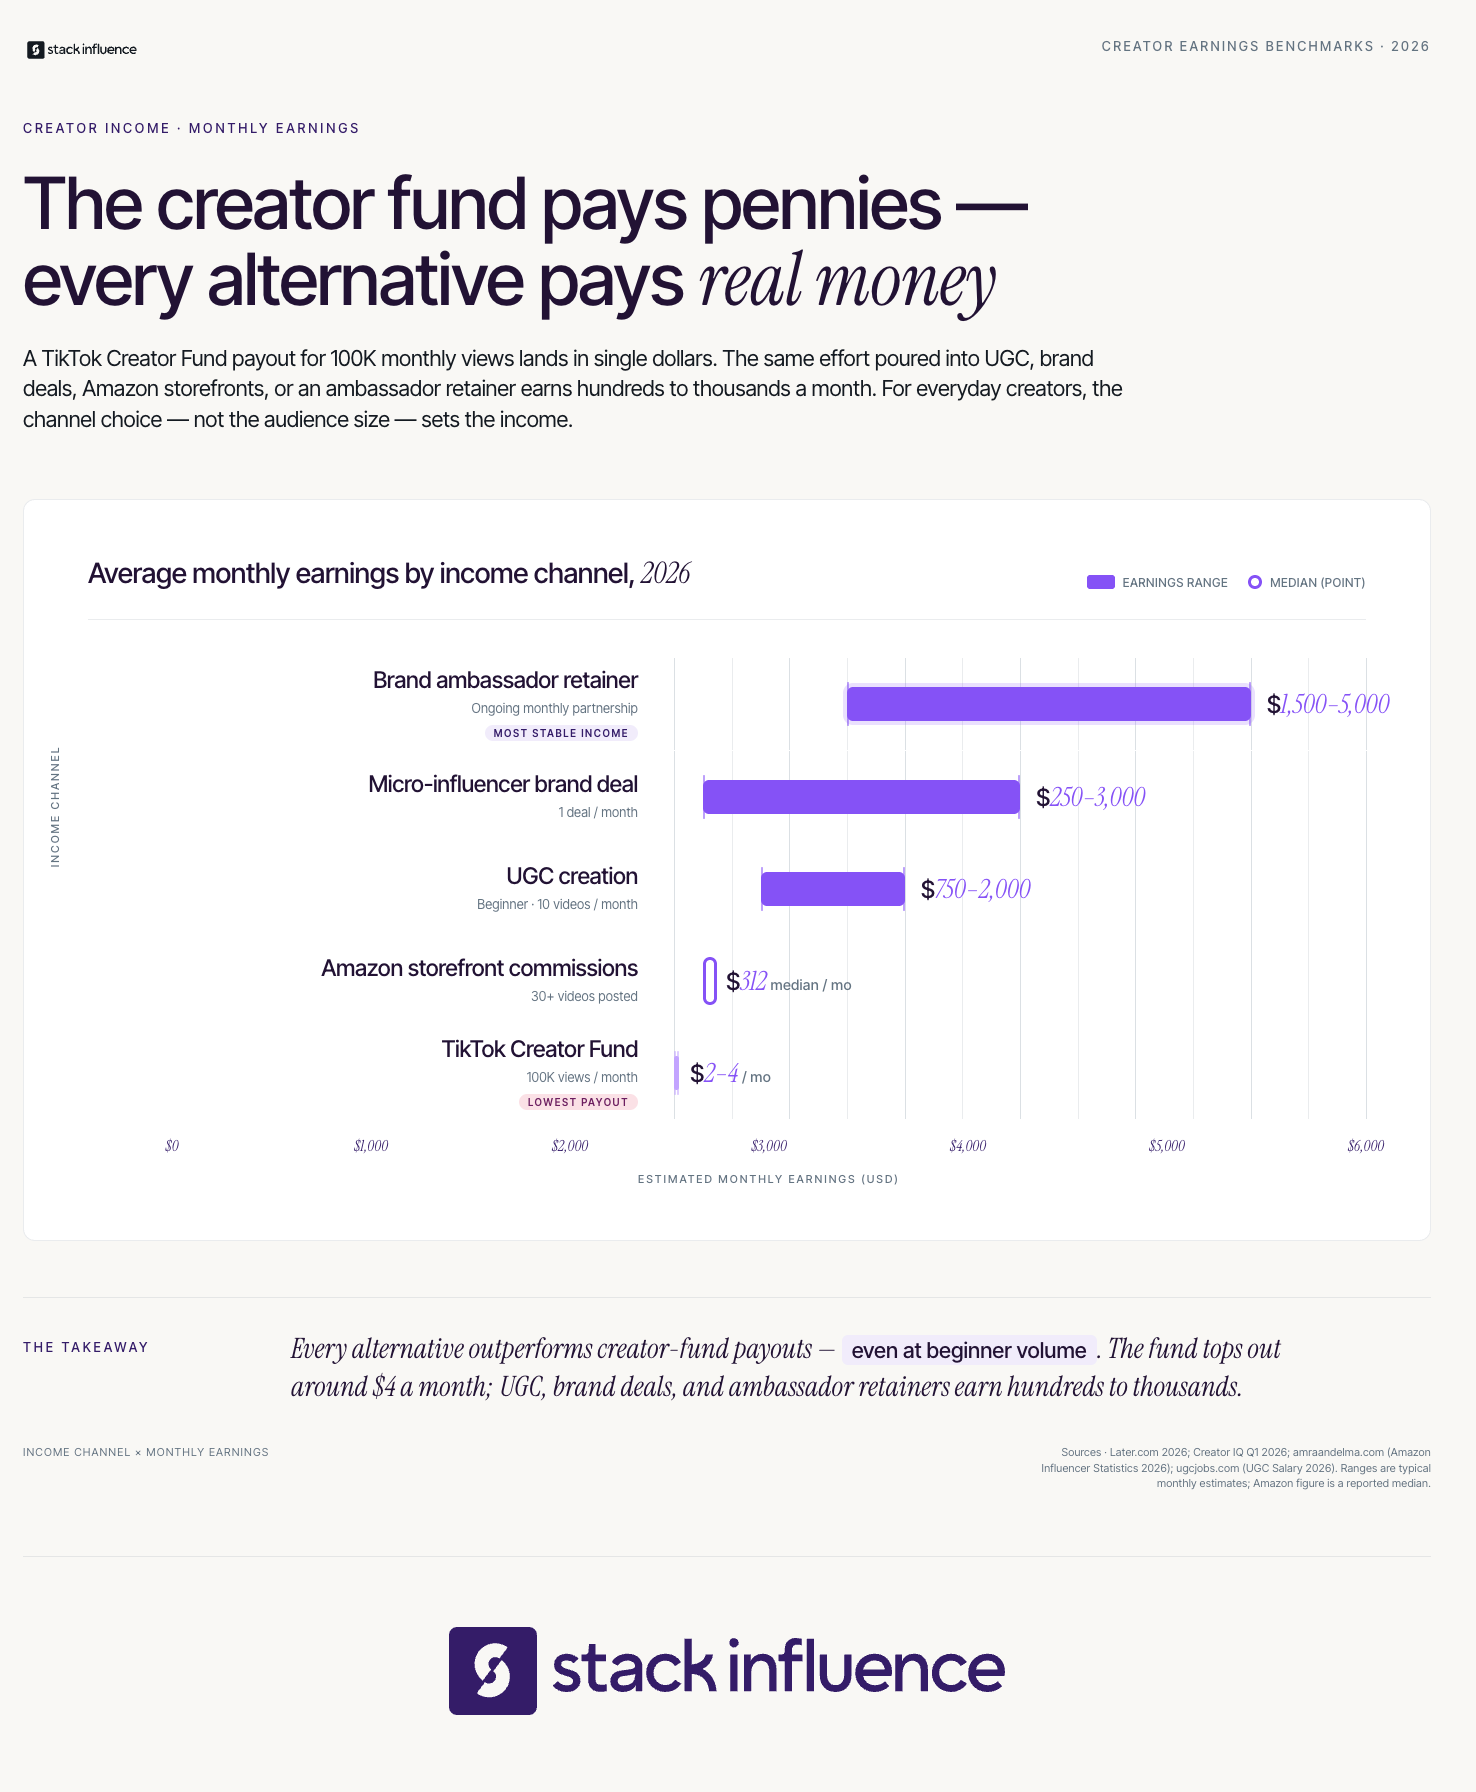
The primary framework for this guide is the PACE Income Architecture, a numbered seven-step sequence that tells creators exactly which income channel to activate first, second, and so on, based on follower count, content format, and time investment. Most creator guides treat revenue streams as interchangeable. The PACE Income Architecture treats them as sequential because early-stage creators who try to run five channels simultaneously generate mediocre results across all of them.
The PACE Income Architecture stands for: Platform-independent channels first, Active income before passive, Commission-based income as the bridge, and Equity-building channels last. Here is the sequence:
The PACE Income Architecture is designed to be sequential but not rigid. A creator with an existing audience of 30,000 followers can enter at Step 4 or 5. A brand-new creator with no following should start at Step 1.
Brand partnerships continue to dominate the creator income landscape, with 82% of creators expecting them as a top revenue stream in 2026.
According to Later data, 54% of creators are also interested in pursuing affiliate marketing, while 42% see real potential in UGC licensing. The PACE Income Architecture reflects these priorities, placing high-converting active income channels at the front of the sequence.
One of the biggest misconceptions in creator fund conversations is that brand sponsorships are reserved for creators with hundreds of thousands of followers. According to 2026 research, 73% of brands favor working with micro and mid-tier creators, micro-influencers achieve 3.86% engagement on Instagram versus just 1.21% for mega-influencers, and brands earn an average of $5.78 for every dollar spent on influencer marketing.
Typical micro-influencer brand deal rates in 2026 range from $250 to $3,000 per post, depending on the platform and content format, with video content for TikTok and Instagram Reels commanding the highest prices due to greater production effort and higher engagement potential. This is the category where the PACE Income Architecture shifts from entry-level income to scalable income.
Across campaigns managed on the Stack Influence platform, micro-influencers in the beauty and personal care category who pitch brands with documented engagement rates above 5% close their first sponsored deal an average of 40% faster than those who pitch on follower count alone. The data consistently shows that brands looking for nano influencers prioritize audience quality over audience size.
Here is what a winning brand deal pitch package includes:
According to the Influencer Marketing Hub's 2026 Benchmark Report, 73% of brands now favor working with micro and mid-tier creators over celebrity partnerships, and the brands increasing budgets by the largest margins are prioritizing creator authenticity over raw reach. This structural shift makes 2026 the strongest environment in history for micro influencers pitching brand partnerships directly.
UGC creation is the single best entry point in the PACE Income Architecture because it decouples income from follower count entirely. In the US alone, spending on UGC content is expected to exceed $10 billion in 2025, up 11% from the prior year, and since 2021 spending on UGC has grown by 100%. The demand is structural, not cyclical.
Stack Influence's internal campaign data shows that UGC creators who begin with product seeding campaigns before pursuing paid brand deals build conversion-proven portfolios in an average of 60 to 90 days, compared to creators who start by pitching cold with no portfolio evidence.
UGC creator rates range from $75 to $200 per video for beginners up to $500 to $1,500 or more per video for experienced creators. As a creator builds a portfolio of brand-approved content, rates can increase without requiring any follower growth. As of 2025, 93% of marketers who used UGC said it outperformed traditional branded content.
UGC platforms worth activating as part of the entry strategy include:
Product seeding is a related but distinct strategy. In a product seeding arrangement, a brand sends a creator free product in exchange for authentic content, without requiring payment or performance guarantees. This is the lowest-risk entry into brand partnerships and creates content assets that serve as proof of competency when pitching paid deals. Brands that work with micro influencers through seeding programs frequently convert those relationships into paid ambassador arrangements over three to six months.
The Amazon Influencer Program is one of the most underutilized creator fund alternatives available to content creators in 2026. Unlike standard affiliate marketing where a creator must drive external traffic to Amazon, the program allows approved creators to upload video reviews directly to product detail pages, earning commissions when shoppers who are already on Amazon watch the video and purchase.
Data from Creator IQ's Q1 2026 State of Creator Commerce report revealed that micro-influencers operating Amazon storefronts saw a median monthly commission income increase of 22% year-over-year, with the average micro-creator now earning $312 per month in pure affiliate commissions, driven largely by increased storefront traffic from Reels and TikTok integrations.
Research from TokPortal's 2026 monetization breakdown shows that a creator with 500,000 focused followers can command $3,000 to $15,000 per dedicated brand video, while the Creator Rewards Program still averages just $0.40 to $1.00 RPM for most creators. This comparison illustrates why the PACE Income Architecture places Amazon commissions and brand deals ahead of any platform fund reliance.
From Stack Influence's experience running Amazon seller influencer campaigns, creators who upload a minimum of 30 product review videos to their Amazon storefront before promoting it externally see significantly higher per-video commission yields than those who promote an underpopulated storefront, because Amazon's internal recommendation system favors storefronts with higher content density.
Setting up an Amazon storefront as a creator involves three practical steps:
The Amazon Influencer Program also functions as an entry point for Amazon FBA sellers and brands looking for creators to generate onsite UGC video, creating a natural pipeline between UGC work and affiliate income.
Here is the contrarian position most guides avoid: engagement rate is not the metric that converts brand deals into revenue. Most creator guides tell micro influencers to obsess over their engagement rate because it is the primary signal brands use. That is partially true, but it misses a critical distinction.
Multiple creators have reported that Creator Fund RPMs drop as their accounts get bigger because more views means the same fixed pot of money gets split more ways. The same dilution logic applies to engagement rate when it is treated as the endpoint rather than the entry point of a pitch conversation. A 6% engagement rate earns you the meeting. It does not close the deal.
Brand deals account for 68.8 to 70% of total creator income, making brand-creator relationships the primary monetization pathway. The specific alternative metric that converts brand deal conversations into signed contracts is documented conversion evidence. This means showing a brand exactly what happened when you recommended a product, which products you drove clicks to, and ideally what the purchase behavior looked like downstream.
The secondary framework for this guide is the Creator Revenue Scorecard, a named checklist that creators should complete before pitching any brand deal or applying to any influencer marketing campaign. The Creator Revenue Scorecard has five components:
Using the Creator Revenue Scorecard before every pitch removes the guesswork from brand deal pricing and positions creators as performance-oriented partners rather than attention renters.
Tracking income across multiple creator fund alternatives requires a different measurement model than tracking platform fund earnings. Platform funds give you a dashboard. Multi-channel creator income requires a framework.
The named measurement model for this guide is the Creator Revenue Yield Stack, with four labeled components:
Influencer marketing platforms that provide campaign-level reporting can significantly reduce the manual work involved in building the Creator Revenue Yield Stack. Brands managing influencer campaigns at scale increasingly expect creators to arrive at campaign conversations with their own performance data already organized.
Stack Influence has observed that micro influencers who track income per hour across at least three revenue channels are significantly more likely to successfully negotiate a rate increase on their second brand deal, because they enter the negotiation with documented ROI evidence rather than follower count comparisons.
When applying the PACE Income Architecture alongside the Creator Revenue Yield Stack, creators can identify which stage of the sequence is generating the best income-per-hour return and choose to deepen that channel before moving to the next step, rather than spreading effort across all seven levels simultaneously.

The highest-income tier of creator fund alternatives is not a single deal but a recurring relationship. Brand ambassadors and long-term brand partnerships represent the most efficient income structure in the PACE Income Architecture because they provide predictable monthly income without requiring constant outreach.
In 2026 planning, the creator mix is moving in a clear direction: brands are expanding nano and micro creator usage far more aggressively than they are expanding macro or celebrity work, with the highest net growth intent sitting at the smallest tiers. This trend creates a meaningful opportunity for micro influencers who can demonstrate consistency and brand alignment to secure long-term ambassador arrangements.
The Creator Revenue Scorecard, applied across six to twelve months of campaign data, becomes the primary pitch document for ambassador conversations. A creator who can show a brand three months of consistent content performance, documented conversion activity, and audience growth in a relevant category is presenting a fundamentally different value proposition than a creator who simply shows their follower count and engagement average.
Brands that work with micro influencers through long-term ambassador structures typically pay monthly retainer fees that range from $1,500 to $5,000 per month for ongoing content deliverables, usage rights, and exclusivity. Monthly retainers in the $1,500 to $5,000 range provide stable income and often work out to higher effective per-video rates than one-off projects. This is the compounding value score in action within the Creator Revenue Yield Stack.
Creators ready to pursue ambassador relationships should prioritize brands that operate in their specific niche, have an existing influencer marketing infrastructure, and actively recruit through brands looking for influencers through structured programs rather than ad hoc outreach. The more systematically a brand manages its creator relationships, the more predictable the income stream becomes for the creator participating in it.
Creator fund alternatives are not backup plans for when platform income disappoints. They are the primary income architecture that sustainable creator businesses are built on in 2026. The PACE Income Architecture gives content creators a clear sequence for activating revenue channels that compound over time, starting with UGC creation and moving toward long-term brand partnerships and ambassador programs. The Creator Revenue Scorecard and Creator Revenue Yield Stack give creators the measurement tools to prove their value and negotiate from data rather than from desperation. For any content creator currently treating a creator fund payout as meaningful income, the shift starts with a single question: which of these seven creator fund alternatives can you activate this week, with the audience and content you already have?
Most eCommerce sellers build their media plans around paid social and Amazon PPC, then wonder why their cost-per-acquisition keeps climbing. Newsletter sponsorship sits in a different category entirely: it reaches audiences who have already raised their hand for curated content in a specific niche. For Amazon FBA sellers and DTC brands trying to diversify off-platform traffic, that intent signal is worth more than a cold impression on a social feed.
Newsletter sponsorship is a brand placement model where an advertiser pays a newsletter publisher to feature their product or offer within a dedicated send or as an inline ad block. Unlike display advertising, the reader has explicitly subscribed to receive content from that publisher, creating a trust transfer that generic programmatic buys cannot replicate. Stack Influence has observed that eCommerce brands running sponsored newsletter placements as part of a broader external traffic strategy consistently show stronger Amazon listing velocity compared to brands relying solely on on-platform advertising.
Here is what makes the current moment strategically important for sellers:
The strategic case is not that newsletter sponsorship replaces paid social. The case is that it does different work in the funnel: it warms audiences who have high purchase intent in a niche your product serves, and it does so at a cost structure that can be made significantly more efficient with proper attribution.
The rising cost of paid social has made eCommerce sellers look harder at owned and earned channels. CPM prices are rising across major social networks, partly due to AI-powered ad offerings that command higher prices, though these often deliver better results for advertisers. Even with improved targeting, many Amazon sellers are finding that the math on cold paid social simply does not work at the margins Amazon's fee structure allows.
Paid newsletter subscriptions have more than tripled since 2021 and are projected to reach $35 million by the end of 2026. That growth is not incidental -- it reflects a meaningful behavioral shift toward curated, trusted content sources. For eCommerce sellers targeting specific niches, that concentrated attention is exactly the right environment for brand sponsorship.
The channel also benefits from structural changes in how digital identity works. As third-party cookie tracking continues to degrade, email-based audiences become more valuable because they are first-party, opted-in, and highly targetable. Sellers who build newsletter sponsorship into their acquisition mix now are positioning themselves ahead of a tracking landscape that continues to tighten.
Consider what this means practically for a DTC brand:
According to Klaviyo's 2026 Omnichannel Benchmark Report, email flows generated nearly 41% of email revenue from just 5.3% of sends, underscoring how behavioral triggers outperform broadcast blasts. Newsletter sponsorships work similarly: a highly targeted send to an engaged audience produces outsized results relative to reach.
Paid subscription revenue on beehiiv hit $19 million in 2025, up 138% from 2024, and the number of creators earning through subscriptions doubled. This growth means newsletter publishers are investing more in audience quality and retention, which directly benefits sponsors who choose to partner with them. For eCommerce brands exploring influencer and creator partnerships, newsletter sponsorship extends that same trust-based marketing model into the inbox.
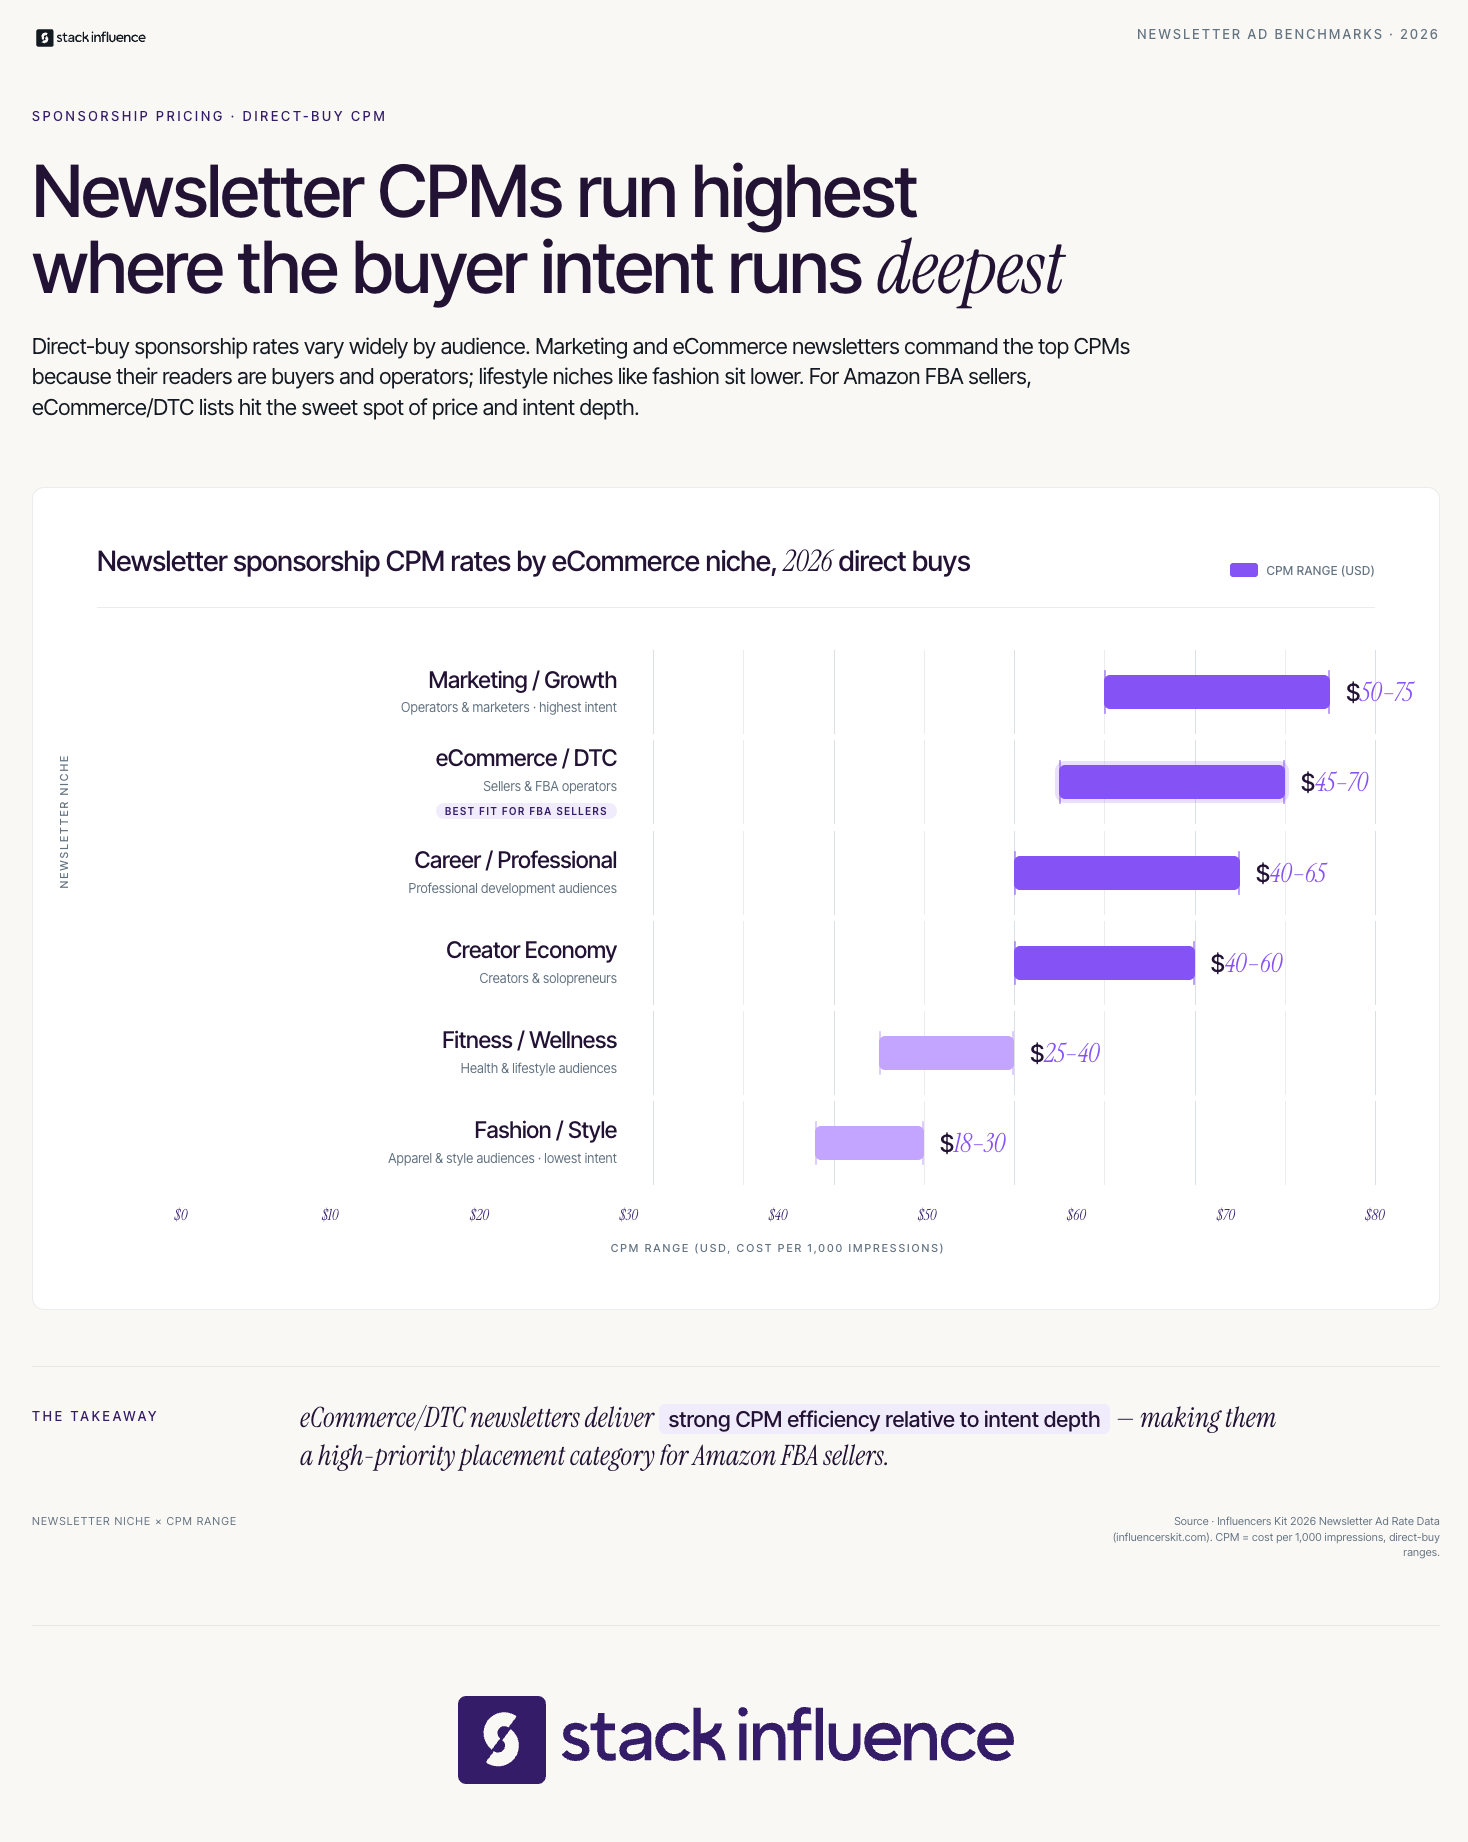
Newsletter sponsorship, in the eCommerce context, is a paid arrangement where a brand places promotional content inside a third-party newsletter that reaches an audience matching their target customer profile. The placement can take the form of a primary ad block at the top of the email, an inline mention mid-newsletter, or a dedicated solo send from the publisher to their full subscriber base. Each format carries different CPM rates, click expectations, and creative requirements.
The most common pricing model remains Cost-Per-Mille (CPM), or price per 1,000 subscribers. However, effective CPMs vary dramatically based on audience size, with smaller, more engaged lists often commanding a premium. An eCommerce brand should never evaluate a newsletter placement on raw CPM alone without accounting for open rate, niche relevance, and audience income bracket.
eCommerce/DTC newsletters command direct CPMs of $45 to $70, making sponsored placements in operator-focused publications one of the most cost-efficient awareness channels available. eCommerce brands advertising to eCommerce operators creates a natural fit. This is particularly relevant for software tools, fulfillment services, and consumer goods brands that want to reach active Amazon sellers or Shopify merchants.
The key distinctions every seller must understand before making their first buy:
Understanding these format differences positions sellers to choose between brand sponsorship and performance sponsorship structures depending on their funnel stage and measurement infrastructure.
The Sponsor-Fit Matrix is the primary decision framework for evaluating newsletter partnership opportunities before committing budget. It maps every candidate newsletter on two variables: Audience Alignment (how closely the subscriber base matches your target customer profile) and Intent Depth (how specifically the newsletter content primes readers toward purchase decisions in your category).
Every newsletter a seller evaluates should be scored on both axes before a deal is negotiated. Using the Sponsor-Fit Matrix this way prevents the common mistake of buying reach in a loosely related niche and then blaming the channel when ROAS disappoints.
Apply the Sponsor-Fit Matrix using these quadrant positions:
A newsletter with 5,000 highly engaged subscribers who click on every recommendation can be worth more than one with 50,000 passive readers who barely open emails. The creator's relationship with their audience plays a huge role as well. When a trusted voice recommends a product, conversion rates skyrocket.
The Sponsor-Fit Matrix should be applied before signing any deal and revisited after the first campaign flight when performance data is available. Sellers running product seeding campaigns alongside newsletter placements often find the strongest audience alignment in newsletters that cover their specific Amazon category or CPG vertical.
From Stack Influence's experience running product seeding campaigns for eCommerce brands, sellers who map newsletter audience demographics against their existing Amazon customer profile before buying see a 35 to 40% improvement in attributed click-to-purchase rates compared to sellers who select newsletters based on subscriber count alone.
Q4 (October through December) sees the most significant rate pressure as direct-to-consumer brands compete aggressively for inbox access during holiday shopping season. CPMs can increase 20 to 40% during this period compared to Q1 and Q2 baseline rates. Smart media buyers book Q4 placements in August or September to lock in pre-peak pricing before premium inventory is claimed.
The Admailr newsletter advertising rate guide reinforces this timing point: booking strategy is as important as newsletter selection when working with a finite test budget. Using the Sponsor-Fit Matrix early in the year means sellers have already vetted their shortlist before prices spike.
The biggest structural change in newsletter sponsorship this year is not the CPM rate. It is the deal structure itself. Most sellers, particularly those entering the channel for the first time, still assume CPM-only pricing is the standard. That assumption is increasingly wrong.
In 2024 and most of 2025, roughly 78% of sponsorships were priced on CPM with no conversion contingency. The remaining 22% were CPA, CPL, or hybrid deals where the publisher got a base CPM plus a per-conversion bonus. In Q1 2026, the CPM-only share dropped to just 51%. CPA, CPL, and revenue-share structures collectively went from 22% to 49% of deals by count and represented 58% of total revenue.
This shift matters because it changes the negotiating dynamic for eCommerce sellers. A seller who enters a newsletter sponsorship negotiation expecting a flat CPM deal may now be offered a hybrid structure instead, which transfers some performance risk from the publisher to the brand's internal funnel. Understanding this shift is the foundation of effective negotiation.
The contrarian read on this data: hybrid deals are not inherently worse for eCommerce sellers. If your product page converts well and your Amazon storefront is optimized, a CPA or revenue-share deal can actually cost less per acquisition than an upfront CPM placement in a newsletter where you cannot guarantee audience fit. The key variable is your own conversion infrastructure, not the deal structure.
Here is what sellers should do immediately in response to this structural shift:
Stack Influence's internal campaign data shows that eCommerce brands using unique Amazon Attribution tags per newsletter placement recover on average 18 to 22% more revenue attribution data than brands using generic tracking links, which directly accelerates the decision to scale or cut a specific publisher relationship.
This section is where the Sponsor-Fit Matrix becomes a living tool rather than a one-time filter. As performance data comes in from early flights, sellers should update each newsletter's Intent Depth score based on actual attributed click-to-purchase behavior, not just assumed audience fit. For brands exploring how micro influencer and newsletter strategies intersect, this data-driven update loop is the same process used to optimize influencer tier selection over time.
The Pre-Buy Audit Checklist is the secondary framework sellers should complete for every newsletter before committing to a placement. Where the Sponsor-Fit Matrix evaluates strategic fit, the Pre-Buy Audit Checklist verifies execution readiness and publisher quality. Complete all seven items before signing.
Apply the Pre-Buy Audit Checklist to every newsletter candidate:
One proprietary insight from beehiiv's platform data: newsletters that maintain professional email subject line practices and consistent publishing schedules see 25% higher sponsor retention rates. This matters because sponsor retention is a proxy signal for newsletter quality -- publishers who retain sponsors are delivering results.
For sellers already running Amazon influencer campaigns through a managed platform, the Pre-Buy Audit Checklist integrates naturally into the same vetting workflow used to evaluate creator partnerships. The due diligence logic is identical: verify the audience, confirm the engagement, and validate that the creative environment is appropriate for the brand.
Across campaigns managed on the Stack Influence platform, eCommerce brands that complete all seven Pre-Buy Audit Checklist items before their first newsletter placement see 50% lower wasted spend in the first quarter compared to brands that buy based on subscriber count and CPM alone.

For Amazon FBA sellers and DTC brands, measuring newsletter sponsorship ROI requires more than tracking clicks. Most standard newsletter reporting focuses on opens and clicks -- metrics that are useful for the publisher but insufficient for a seller who needs to connect placement cost to margin-adjusted revenue. The measurement framework that closes this gap is the TRACE Metric Model.
The TRACE Metric Model is a five-component attribution stack designed specifically for eCommerce sellers running newsletter sponsorships alongside marketplace and DTC sales channels. Reference the TRACE model every time you evaluate a new placement or optimize an existing publisher relationship.
The five components of the TRACE Metric Model:
The standard attribution flow is: external click drives Attribution tag to fire, shopper lands on your Amazon listing or storefront, purchase occurs within 14 days, Amazon calculates the bonus, and credit appears in your account. Every letter in the TRACE model corresponds to a specific stage in this flow.
Amazon's Brand Referral Bonus is an opportunity to earn, on average, a 10% bonus of the sales price on sales generated from non-Amazon marketing efforts. For a seller with a $40 product at a 15% referral fee category, the Brand Referral Bonus effectively returns $4 per attributed sale back as a fee credit. Factoring this into the "A" component of the TRACE model often reveals that newsletter-driven CAC is 10 to 15% lower than initial reporting suggests.
According to Brevo's 2026 Marketing Orchestration Benchmark, the average open rate is 20.73% (33.87% including Apple MPP), and the average CTR is 2.27% for marketing campaigns, with top 10% performers reaching 5.22%. These benchmarks give sellers context for evaluating publisher performance claims. Any newsletter claiming 10%+ CTR for sponsored placements without supporting verification data should be treated with skepticism during the Pre-Buy Audit Checklist process.
Apple Mail Privacy Protection now affects roughly 50 to 60% of recorded email opens, inflating open rate data and making open rate a less reliable engagement metric. This is the core reason the TRACE Metric Model anchors to Revenue Per Attributed Click rather than open rate. Sellers who build their optimization decisions around open rate are working with a metric that is structurally unreliable for half of the recipient base.
Applying the TRACE Metric Model across publisher relationships gives sellers a consistent basis for comparison that no single platform metric can provide. For brands that also use Amazon influencer storefronts as part of their traffic mix, the same attribution logic applies: tagged links, 14-day windows, and net-of-bonus CAC as the decision metric.
Once the Sponsor-Fit Matrix and the TRACE Metric Model are in place, scaling newsletter sponsorship is a data-driven process rather than a guessing game. The principle is straightforward: start narrow, prove the attribution loop, then expand.
A practical scaling sequence for eCommerce sellers:
Amazon is more generous than most eCommerce referral programs: any brand purchase within 14 days of a referral click qualifies for the Brand Referral Bonus, compared to the standard 24-hour last-click conversion window used by most platforms. This extended window is critically important for newsletter traffic because readers often click, browse, and purchase over several days rather than in a single session.
Since Apple Mail accounts for 46% of email clients, its technical privacy changes have significantly skewed open rate data upward. Email marketers now prioritize click-through rates, click-to-open rates, and conversion metrics over open rates when evaluating campaign performance. This reinforces why scaling decisions in the TRACE Metric Model should never be driven by open rate data alone.
Brands that are already running influencer seeding campaigns to generate UGC can amplify newsletter sponsorships by pairing them with creator content. A newsletter placement that links to a product listing supported by strong review volume and influencer-generated imagery converts at a meaningfully higher rate than a cold listing. This integration between Amazon storefront optimization and newsletter traffic strategy is where DTC brands consistently outperform pure Amazon-native sellers.
For brands with sufficient volume, consider building a rotating editorial calendar: book Q1 placements in niche-fit newsletters with high Intent Depth, use Q2 and Q3 to test category-adjacent publications at lower CPM, then return to the highest-performing niche publishers in Q4 at pre-booked rates. This calendar approach applies the Sponsor-Fit Matrix systematically across the full year rather than reactively when budget becomes available.
Newsletter sponsorship is not a niche tactic -- it is a structurally underpriced external traffic channel that most eCommerce sellers are leaving unworked. The combination of trusted editorial audiences, Amazon Attribution's 14-day lookback window, and the Brand Referral Bonus creates a margin recovery mechanism that makes newsletter sponsorship more economical than its gross CPM suggests. Using the Sponsor-Fit Matrix to select publishers, running every candidate through the Pre-Buy Audit Checklist, and tracking outcomes with the TRACE Metric Model gives sellers a repeatable system that compounds over time. eCommerce brands that build this infrastructure now, before newsletter inventory tightens and CPMs normalize upward, will hold a durable CAC advantage over competitors who wait. Start with two newsletters, tag everything, and let the attribution data tell you where to scale.
Consumer skepticism toward traditional advertising has reached a structural ceiling. Brands are no longer competing purely on product features or price; they are competing for the right to be believed. The creator economy sits directly at the center of this trust gap, and that positioning is not accidental.
The global influencer marketing industry is projected to reach $32.55 billion in 2025, according to multiple industry analyses, and the fastest growth is happening at the micro and nano tiers where authentic relationships live. Brands are not chasing follower counts anymore. They are chasing proof that a real person made a real purchase decision because of a creator's content.
Consider what this means for influencer campaigns specifically:
The operational challenge for content creators is not how to get more brand deals. It is how to generate the kind of social proof that makes brands want to lock in long-term brand sponsorship agreements and brand ambassador relationships. Understanding that distinction is what separates transactional creators from strategic ones. Exploring what niche micro-influencers deliver differently from generalist creators is a useful starting point for any creator repositioning their value proposition.
Social proof marketing is the practice of using real human experiences, endorsements, and behaviors to build consumer trust and accelerate purchase decisions. The concept originates in social psychology, specifically the idea that people look to others when deciding how to act in uncertain situations. In a commerce context, social proof translates into a measurable purchase trigger.
The most common forms of social proof in the creator economy include customer reviews, UGC video, user-generated photos, influencer testimonials, product seeding outcomes, and follower-visible engagement signals. Each type functions differently depending on where in the funnel a potential buyer encounters it.
Social proof marketing differs from traditional endorsement advertising in one critical way: the source of the signal. Brand-sponsored statements and polished campaigns generate minimal trust transfer. Content that originates from a recognizable human voice, even an unfamiliar one, transfers credibility far more efficiently. Understanding the full landscape of influencer marketing in 2026 reveals just how fast this trust dynamic is shifting platform behaviors.
Most creators approach social proof as a byproduct of their content, something that happens after they post. Strategic creators approach it as an engineered output, something they deliberately design each piece of content to produce. This reframe changes everything from the brief they accept to the metrics they report back to brands.
According to MarketingProfs, micro-influencers often achieve engagement rates averaging 7% to 20%, while macro-influencers typically see engagement rates around 5%, a gap that directly determines which tier generates more usable social proof per dollar spent. That engagement differential is not a vanity stat. It is the mechanism by which smaller creators outperform larger ones on the metric brands actually care about: downstream conversion from trust.
Creators who want to become proof generators rather than impression machines should internalize these operating principles:
This shift in thinking is also what makes micro-influencer and UGC content in eCommerce so valuable to Amazon sellers and Shopify brands. The content itself becomes a reusable trust asset long after the original post stops generating organic reach.
The Social Proof Stack is the primary framework for this article. It is a five-item checklist that every creator should run before, during, and after any brand partnership to confirm they are generating maximum trust signal, not just content volume. Reference this checklist every time you accept a product seeding arrangement or negotiate a brand sponsorship.
Research compiled by Bazaarvoice shows that 77% of shoppers are more likely to buy a product they first discovered through UGC, and product pages featuring UGC see up to 140% higher conversion rates when shoppers engage with that content. That data point defines the ceiling of what your content can do when the Social Proof Stack is fully deployed.
The five items in the Social Proof Stack are:
Data from Datapins shows that consistent social proof can increase revenue by 62% per customer, and 84% of consumers place greater trust in brands that incorporate UGC into their marketing campaigns. Running the Social Proof Stack before every campaign is how creators ensure their content lands in the "consistent" bucket rather than the "occasional" one.
Stack Influence's internal campaign data shows that product seeding campaigns where creators received specific outcome-oriented briefs rather than open-ended creative direction produced UGC reuse rates above 65%, compared to roughly 40% for campaigns with purely aesthetic briefs. The Social Proof Stack gives creators the structure that makes those specific briefs possible to fulfill.
The Proof Activation Sequence is the secondary framework in this article. Where the Social Proof Stack is a checklist of what to produce, the Proof Activation Sequence is a four-step operational order for how a creator should activate social proof across a brand partnership lifecycle. Reference this sequence when structuring a multi-post campaign or long-term brand ambassador relationship.
The Proof Activation Sequence has four steps:
Product seeding for eCommerce brands works most effectively when the creator follows something close to this sequence, because it ensures the brand receives layered proof rather than a single impression. Platforms offering automated product seeding are specifically designed to enable this kind of multi-touch creator workflow at scale.
Most creators treat measurement as a brand's problem. That framing leaves significant money on the table. When creators track and report their own social proof metrics, they build a performance case that justifies higher rates, longer contracts, and more creative autonomy. The measurement gap is where strategic creators gain durable competitive advantage.
According to Zebracat's influencer marketing statistics analysis, 61% of brands report higher ROI from micro-influencers than from macro-influencers, and campaigns using micro-influencers see 28% higher repeat customer purchases than those using macro-influencers. Brands already know micro-tier is more efficient. Creators who measure and quantify that efficiency become irreplaceable.
The named metric model that every creator should maintain is the Creator Proof Score, a four-component stack that can be reported to any brand partner:
From Stack Influence's experience running product seeding campaigns for Amazon sellers and DTC brands, creators who report Review Velocity as a deliverable metric consistently command 20% to 35% higher campaign fees than creators who report only reach and engagement. The Amazon Influencer Program and Amazon Attribution tools are specifically designed to make Review Velocity trackable. Creators who integrate these into their reporting immediately elevate their position in brand negotiations. The Creator Proof Score is the reporting layer that transforms these individual metrics into a single, readable brand asset.
Here is the contrarian truth most influencer marketing guides will not tell you: the social proof signal that creators generate is not primarily determined by how polished the content looks. It is determined by how honest it sounds.
The Sprout Social 2025 Influencer Marketing Report found that 64% of consumers say genuine reviews compel them to make a purchase, compared to only 55% for discount codes, signaling that authentic content outperforms incentive-first strategies. This is a direct challenge to the common creator playbook that leans heavily on promo codes and limited-time offers as conversion drivers.
The data suggests a specific behavioral pattern: consumers do not need to be bribed into purchasing after encountering credible social proof. They need to be convinced. The distinction matters because it shifts what "good content" means for a brand deal.
Here is what the data says you should actually change:
Across campaigns managed on the Stack Influence platform, brands that briefed creators to include at least one honest qualification or product caveat in their content saw a 22% higher UGC reuse rate in paid ad creative compared to campaigns that requested exclusively positive framing. The market is rewarding honest content because audiences are exceptionally good at detecting the difference. This is a foundational principle within holistic marketing strategies built around micro influencers.
The challenge with scaling social proof as a creator is that the same authenticity that makes the content valuable becomes harder to maintain when the volume of brand partnerships increases. Creators who accept every deal, regardless of personal relevance, dilute the trust signal their audience has in all their content, not just the deals that feel forced.
According to Sprout Social's 2025 Influencer Marketing Report, 86% of consumers make at least one influencer-inspired purchase per year, and nearly half make purchases driven by creator content every single month. That purchase frequency is not uniformly distributed. It concentrates heavily around creators whose audiences have developed a pattern of trusting their recommendations because the recommendations have historically been relevant.
To scale social proof output without losing credibility, creators should apply the Social Proof Stack and Proof Activation Sequence as filters, not just campaign tools:
Data from Stack Influence's work with eCommerce brands in beauty and personal care categories shows that creators who maintained fewer than four active brand relationships at any given time generated UGC that brands reused in paid ads at twice the rate of creators with eight or more simultaneous partnerships. Audience trust is finite, and social proof scales only when that trust is protected, not commoditized.
The operational infrastructure for scaling credibly includes influencer marketing platforms that match creators to relevant brands rather than volume-first approaches. Creators on platforms built for quality matching, as opposed to self-sourced deals, consistently report stronger long-term brand partnership terms. For creators exploring what sustainable partnerships look like in practice, reviewing real-world influencer marketing case studies provides a useful calibration baseline.
Data from Wisernotify shows that products with five or more reviews are 270% more likely to be purchased than products with zero reviews, making review volume one of the most measurable social proof investments creators can facilitate. That single metric quantifies what you are actually worth to a brand when you run the Social Proof Stack correctly: you are not just a reach vehicle, you are a review engine. That is the positioning that makes social proof marketing a long-term career strategy, not a campaign-by-campaign negotiation.
Social proof marketing is the only kind of marketing that gets stronger the more genuinely it is practiced. For content creators and influencers, that means the path forward is not bigger audiences or more brand deals. It is more credible content, engineered through frameworks like the Social Proof Stack and the Proof Activation Sequence, and measured through a rigorous Creator Proof Score that brands cannot ignore.
The creator economy is still rewarding volume, but the highest-performing brand partnerships are migrating toward creators who understand that trust is a compound asset. Each honest review, each authentic UGC video, and each well-structured piece of creator content builds on the last. Micro influencers and nano influencers who deploy this approach deliberately will find that social proof marketing becomes their most durable competitive advantage in the brand partnership market, regardless of how crowded the creator landscape becomes.
Apply the frameworks in this article, measure what matters, and protect the authenticity that makes your content worth anything to a brand in the first place.
Brands are moving budget away from polished studio ads faster than most content creators realize. The global UGC platform market reached $7.6 billion in 2025, up 69% from $4.5 billion in 2024, signaling explosive adoption by brands across sectors. That growth represents a direct opportunity for creators who know how to position themselves as strategic partners, not just posting machines. This guide gives you the frameworks, metrics, and tactical moves to turn your UGC marketing capability into a sustainable, high-value revenue stream.
Most creators treat UGC as a transaction. A brand sends a product, you make a video, and the deal ends. The creators building serious income in the creator economy treat it as a strategic capability with a documented track record.
Your positioning starts with understanding why brands actually pay for UGC. They are not buying your audience; they are buying content that performs in their paid and organic channels. According to eMarketer's analysis of Collabstr's 2026 influencer marketing report, authenticity (35%) and track record (32%) are the two top factors US adults consider when deciding which online product reviewers to trust. Brands know this and choose creators accordingly.
To position yourself effectively as a UGC creator, build evidence across these four dimensions:
Creators who lead with performance proof rather than follower count consistently close better brand deals. The shift from "influencer" to "UGC creator" is largely a positioning shift; it reframes what you are selling from audience reach to content performance.
UGC marketing is the practice of sourcing, activating, and distributing content created by real people, including customers, micro influencers, nano influencers, and dedicated UGC creators, to achieve measurable business outcomes for brands. It encompasses photo reviews, video testimonials, unboxings, tutorials, and social proof formats deployed across paid ads, organic feeds, product pages, and email campaigns. This growth reflects both increased marketer sophistication and consumer demand for authentic content.
The category has two distinct operating models that every creator should understand. Organic UGC is content a customer creates voluntarily without compensation, such as an unboxing posted spontaneously. Commissioned UGC is content created by paid creators specifically for brand use, produced in a native, authentic style but contracted and licensed by the brand. Most brand deals in 2026 involve commissioned UGC, and the entire landscape of UGC platforms has organized itself around this model.
What makes UGC marketing distinct from traditional influencer campaigns is the primary use case. In a traditional influencer campaign, the brand is paying for distribution through your audience. In a UGC campaign, the brand is paying for content assets it will distribute itself, often in channels where you as a creator have no presence at all. This distinction matters enormously when you are pricing your work and negotiating usage rights.
The Content-to-Conversion Framework, or C2C, is the primary framework for producing UGC that brands can deploy directly without reshoots or heavy editing. It gives you a four-stage production logic that aligns your creative process with how brands actually use UGC across their channels. The C2C framework is referenced throughout this guide because it applies at every stage of a brand partnership.
The four stages of the C2C Framework are:
According to Yotpo's analysis of 200,000 ecommerce businesses, people who view UGC on a site are converting 161% more than those who see no UGC at all. That number is driven almost entirely by content that clears all four C2C stages. Content that stalls at Stage 2 generates awareness but not conversion lift.
Though the presence of UGC impacts conversion, the real magic happens when visitors interact with content; in 2022, there was a 102.4% lift in conversion among UGC interactors. Brands know interaction is the goal, and the C2C framework is designed to produce content that earns it. Refer back to the C2C framework whenever you are structuring a brief for a new creator partnership, because each stage maps directly to a measurable audience behavior.
Stack Influence has observed that micro influencer UGC produced with a clear four-stage narrative structure generates significantly higher content reuse rates among eCommerce brands, particularly in beauty, personal care, and CPG categories where before-and-after conviction moments drive purchase intent at the product page level.
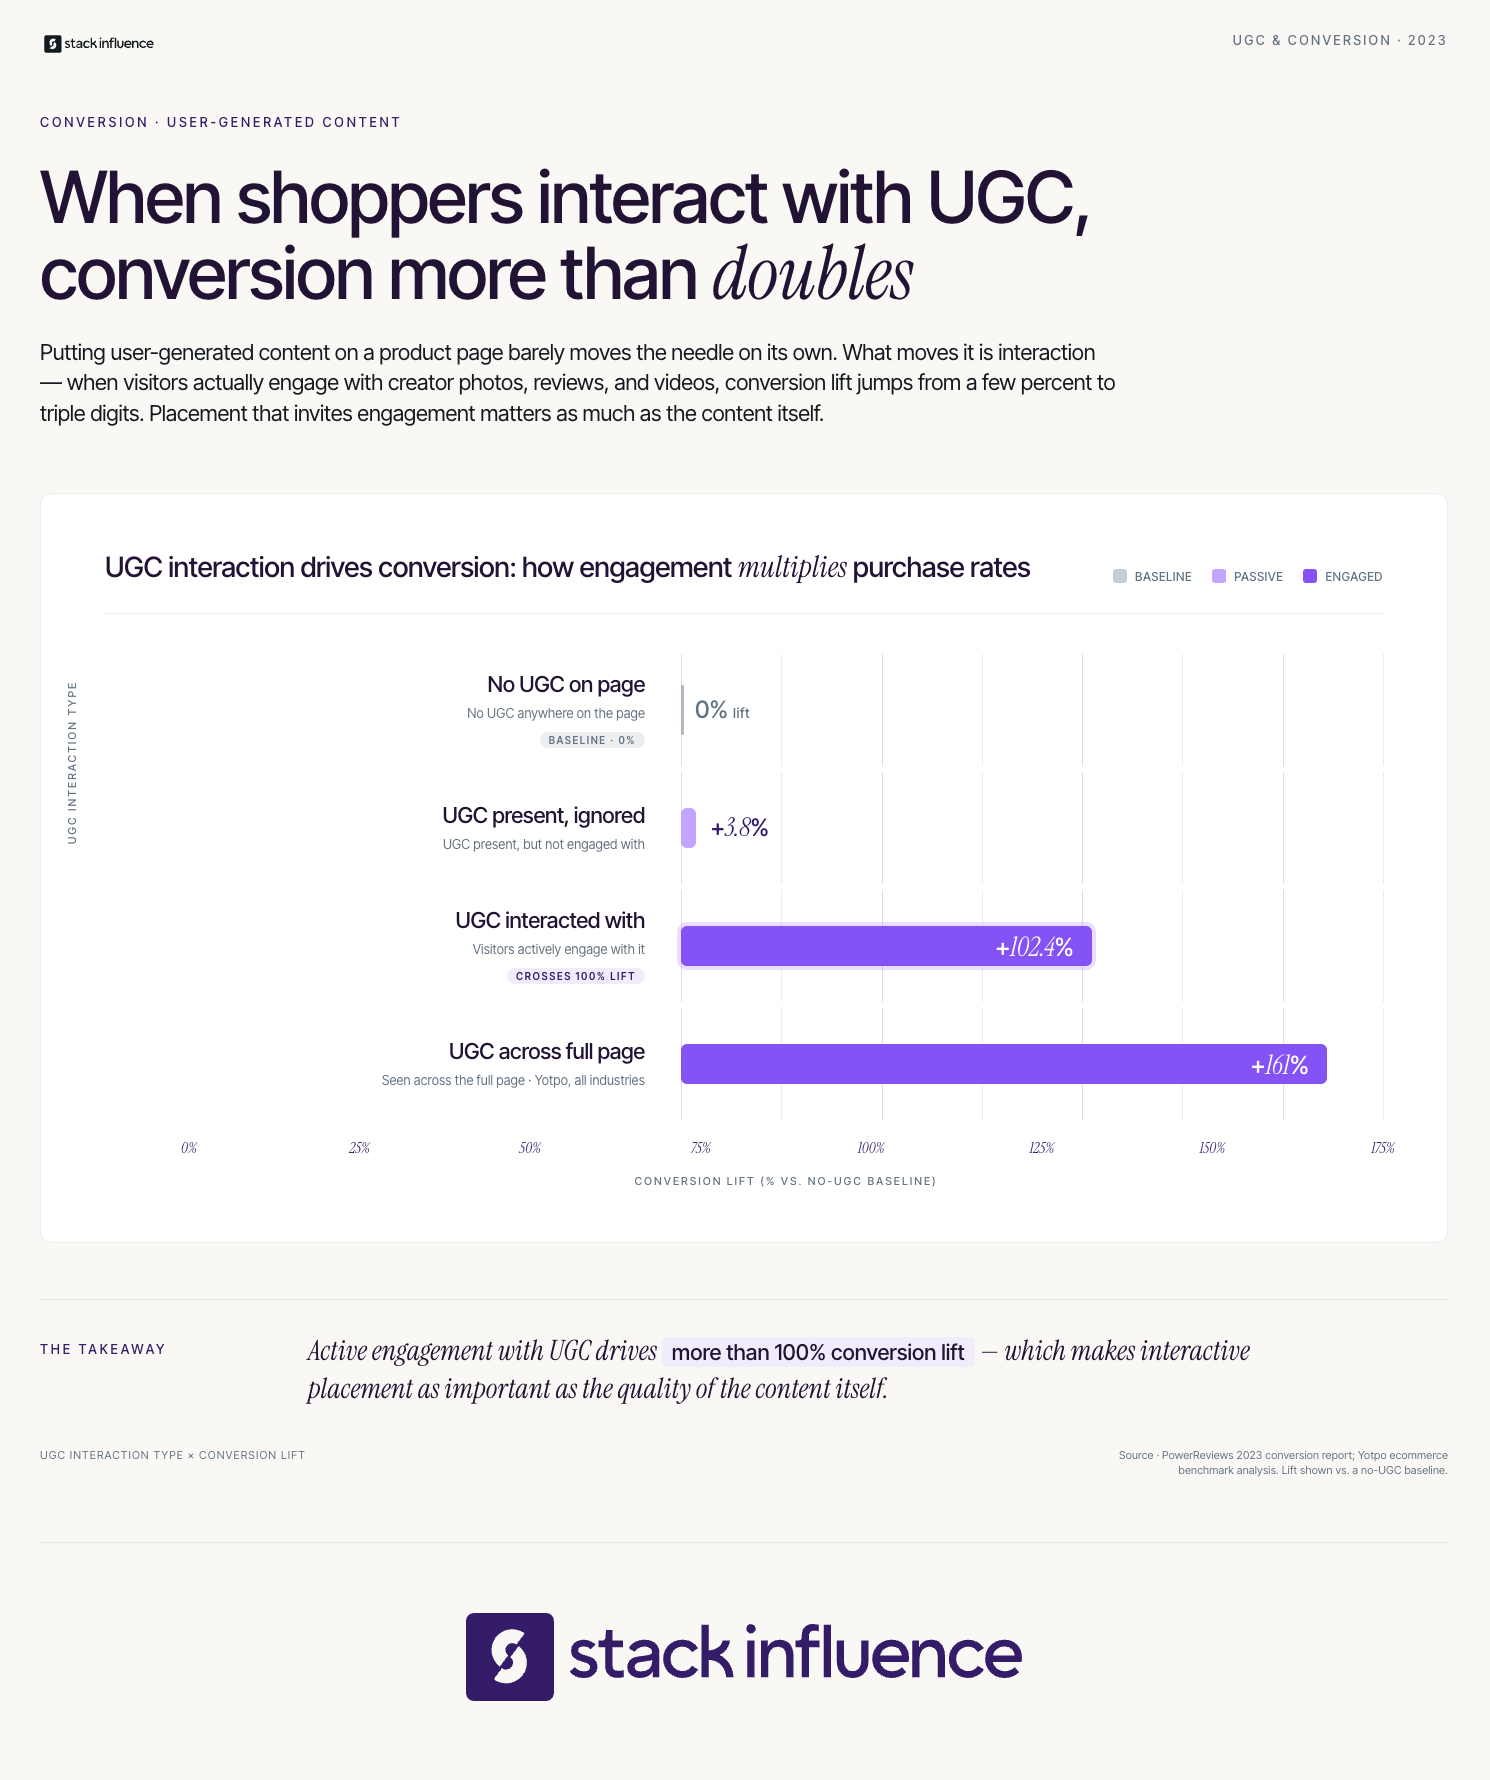
UGC video is the highest-value deliverable in most brand deals right now, and creators who optimize for video performance rather than static content command meaningfully higher rates. The reason is simple: brands running performance media need native-feeling video creative at a volume that no internal team can produce alone.
TikTok For Business data shows that TikTok One creator content boosted with Spark Ads drove a 159% higher engagement rate than non-creator content posted directly in TikTok Ads Manager. That performance gap is the business case brands use to justify paid UGC creator programs. Understanding this number puts you in a stronger position when quoting rates for content with paid amplification rights.
The most in-demand UGC video formats for brands in 2026 follow a clear pattern:
Across campaigns managed on the Stack Influence platform, UGC video content produced by micro influencers in the beauty and personal care category consistently achieves content reuse rates above 60%, compared to roughly 40% in general lifestyle categories, because product demonstration formats translate directly into paid creative without post-production adjustment.
Product seeding is the most common mechanism brands use to initiate a UGC video relationship. Understanding how influencer seeding works for eCommerce lets you set expectations about timelines, posting requirements, and repurposing terms before you accept a product shipment.
The Creator Revenue Stack is the measurement model every UGC creator should use when reporting campaign performance to a brand and when evaluating which partnerships to prioritize. It has four labeled components, and you should reference the Creator Revenue Stack with every brand report you send.
The four components of the Creator Revenue Stack are:
According to Kantar's 2025 analysis, influencer content in ads captures attention for 2.2x longer than standard digital ads, making attention duration a meaningful proxy for content quality that brands increasingly track. The Creator Revenue Stack gives you a structured way to present that data in a format brand partnerships teams can act on immediately.
Industry data shows influencer campaigns average $5 to $6.50 in revenue per $1 spent, and micro-influencers often outperform this baseline. When you present the Creator Revenue Stack in a post-campaign report alongside that benchmark, you make your ROI case in the brand's language rather than your own.
The UGC Creator Activation Checklist is the secondary framework in this guide. It gives you a practical audit to run before accepting any new brand partnership, and it is distinct from the C2C content production framework because it operates at the deal-structure level, not the content-execution level. Reference this checklist every time you are evaluating a new brief.
The eight items in the UGC Creator Activation Checklist are:
Data from Stack Influence's micro influencer campaigns suggests that creators who complete all eight checklist items before a campaign kickoff experience fewer post-delivery disputes, faster payment cycles, and significantly higher rates of repeat brand partnerships than those who begin production before deal terms are fully confirmed.

Amazon FBA sellers and DTC brands on Shopify have become the most active buyers of commissioned UGC content in the creator economy. The reason is structural: both platform types have direct conversion data that lets them calculate the ROI of each UGC asset within days of deployment. That measurement capability makes them faster to scale budgets when your content performs.
For Amazon sellers, the UGC value chain starts at the product detail page. On-Amazon creator content consistently outperforms external social posts because it reaches shoppers already primed to evaluate products. The Amazon Influencer Program allows approved creators to upload shoppable video content directly to product listings, earning a commission on every conversion driven by that content. This creates a dual income structure: a flat fee from the brand for content production, plus ongoing commission revenue tied to product page performance.
For DTC brands and Shopify sellers, the UGC use case extends into paid media. Brands running Meta partnership ads need creator content with native rights, and many of the fastest-growing brands that work with micro influencers build their entire paid media creative library from commissioned UGC. Understanding the Amazon Brand Referral Bonus structure and how Amazon Attribution tracks external traffic helps you pitch a complete UGC strategy to Amazon sellers, not just a social post.
The most effective creator partnerships for both seller types involve product seeding via automated workflows, where the brand ships product directly in exchange for content rights, and the creator uses the C2C framework to produce video that works both as organic social content and as a paid creative asset. That dual-use positioning consistently commands higher rates than single-platform deals.
Here is the specific belief most creators hold right now that is worth challenging directly: more followers means more brand deals and higher UGC rates. The data does not support it.
Research found that nano and micro-influencers achieved roughly double the sales conversion rate of macro influencers in one analysis, with about 7% of engagements converting to sales for small influencers versus 3% for large influencers. Brands running performance-focused influencer campaigns have known this for years. What changed in 2026 is that the measurement infrastructure has become mainstream enough that even early-stage DTC brands can see the per-asset conversion data that makes nano and micro creators the obvious choice for UGC programs.
The specific alternative metric you should lead with in every pitch is content reuse rate, which is the Reuse Conversion Score from the Creator Revenue Stack. A creator with 8,000 followers whose content is reused across 12 paid ad placements, three product pages, and two email campaigns generates far more measurable value than a creator with 120,000 followers whose content is posted once and archived. The hidden ROI layer is creative velocity: a traditional photo or video shoot with an agency can cost $50,000 and yield 10 to 15 usable assets, while a micro-influencer campaign of the same budget might yield 200+ pieces of authentic UGC.
This week, update your creator media kit to replace your follower count headline with a content reuse rate metric. Pull the number from your last three brand partnerships by counting how many times each brand redeployed your content in new placements. Even a reuse rate of 3 to 4 deployments per piece is enough to differentiate you from creators who only report engagement metrics. Brands looking for niche micro influencers to anchor their UGC programs are actively screening for this kind of performance signal.
UGC marketing is the most durable opportunity in the creator economy right now because it aligns creator income with brand performance rather than audience size. Creators who master the Content-to-Conversion Framework, apply the UGC Creator Activation Checklist before every deal, and report results through the Creator Revenue Stack model will consistently outperform peers who treat content creation as a one-sided transaction. The brands investing in influencer marketing platforms, product seeding programs, and commissioning UGC video at scale are not slowing down; they are building the infrastructure to do this at volume. Your role in that system becomes more valuable every time you produce a piece of content that a brand deploys in five different channels instead of one.